 getabite
Press kit: vegan cities
Open data on vegan and vegetarian places tagged in OpenStreetMap across curated cities. Free to use with attribution.
Methodology
What we counted, where it comes from, and how coverage limits the claims.
- We count restaurants, cafes, fast-food places, and food courts inside a fixed radius around each city centre. Diet tags come from OpenStreetMap: vegan-only, vegan options, vegetarian-only, and vegetarian options. Population comes from Wikidata.
- OpenStreetMap via the Overpass API (ODbL). Population figures from Wikidata (CC0). No live Overpass calls on this page.
- Data retrieved September 22, 2026.
- Coverage means places with a diet:vegan or diet:vegetarian tag divided by all counted food places. A city needs at least 5 percent coverage and at least 5 diet-tagged places to receive a rank. Below that, the limiting factor is mapping, not necessarily the city.
- These figures describe tagged OpenStreetMap places, not a census of vegan restaurants. Higher scores can reflect denser tagging, denser hospitality, or both.
Key findings
A short, factual summary you can quote. No claims the snapshot does not support.
In the GetaBite snapshot of 67 cities retrieved September 22, 2026, 31 cities had enough OpenStreetMap diet tagging for a ranked comparison. The other 36 appear in a separate thin-data list without a rank.
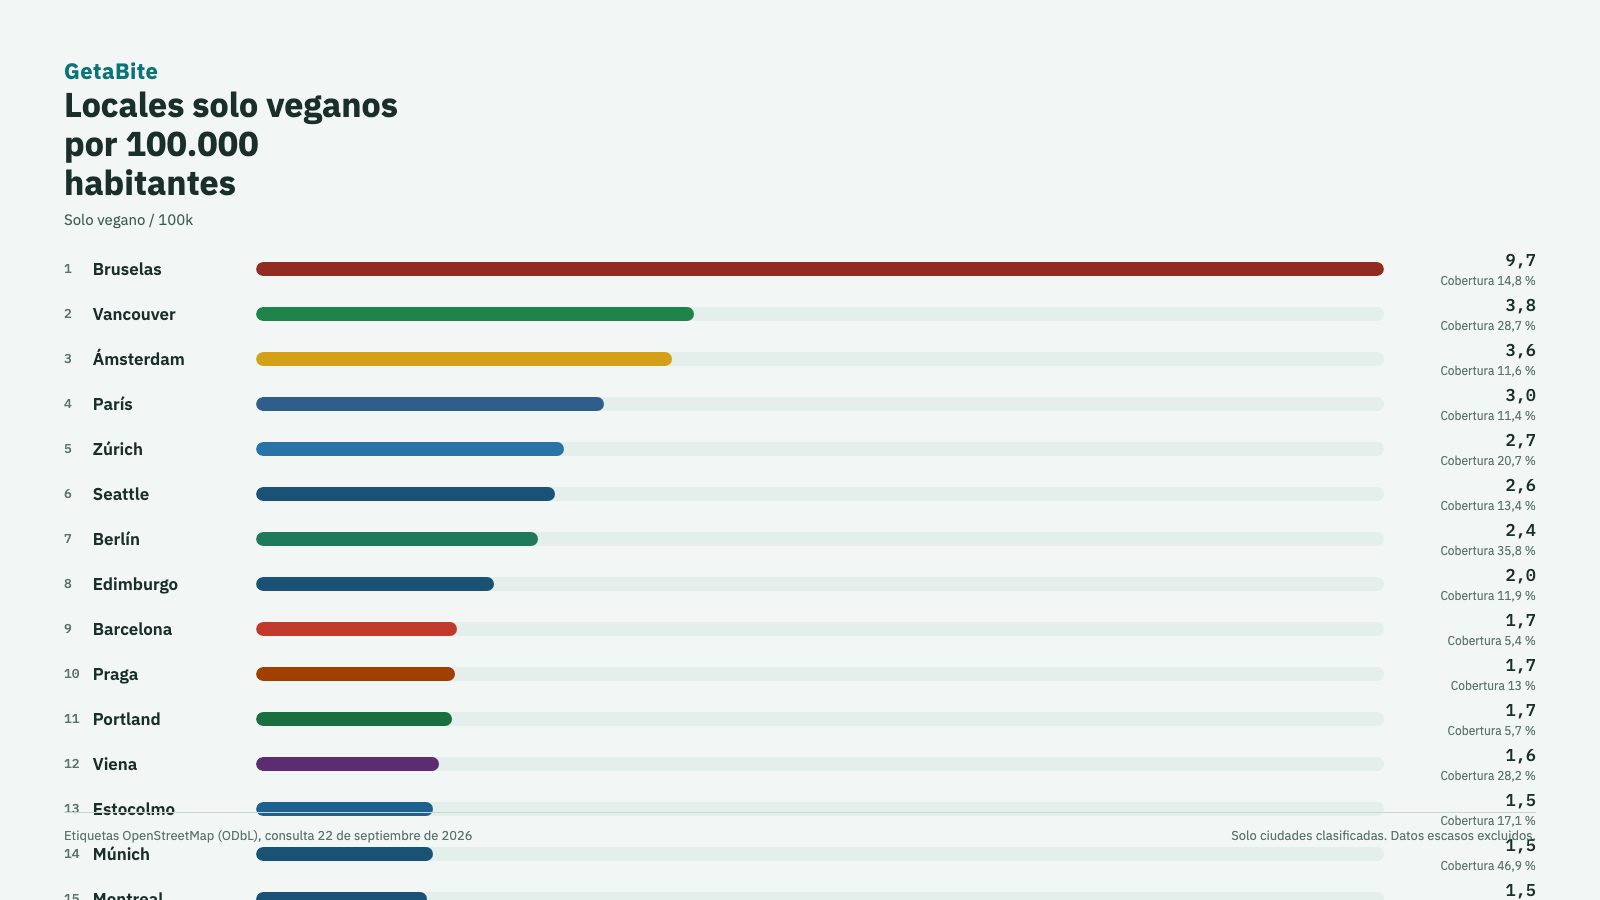
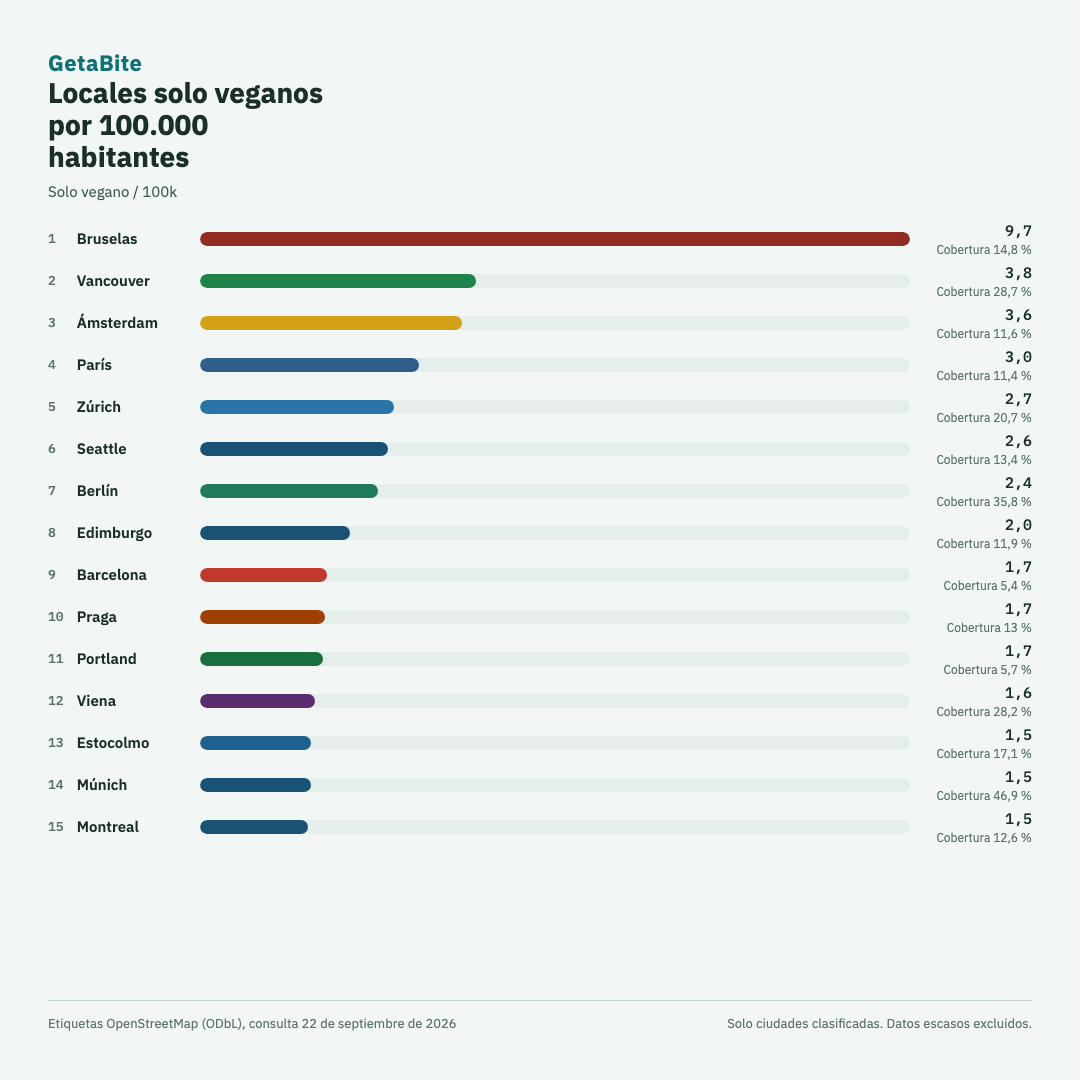
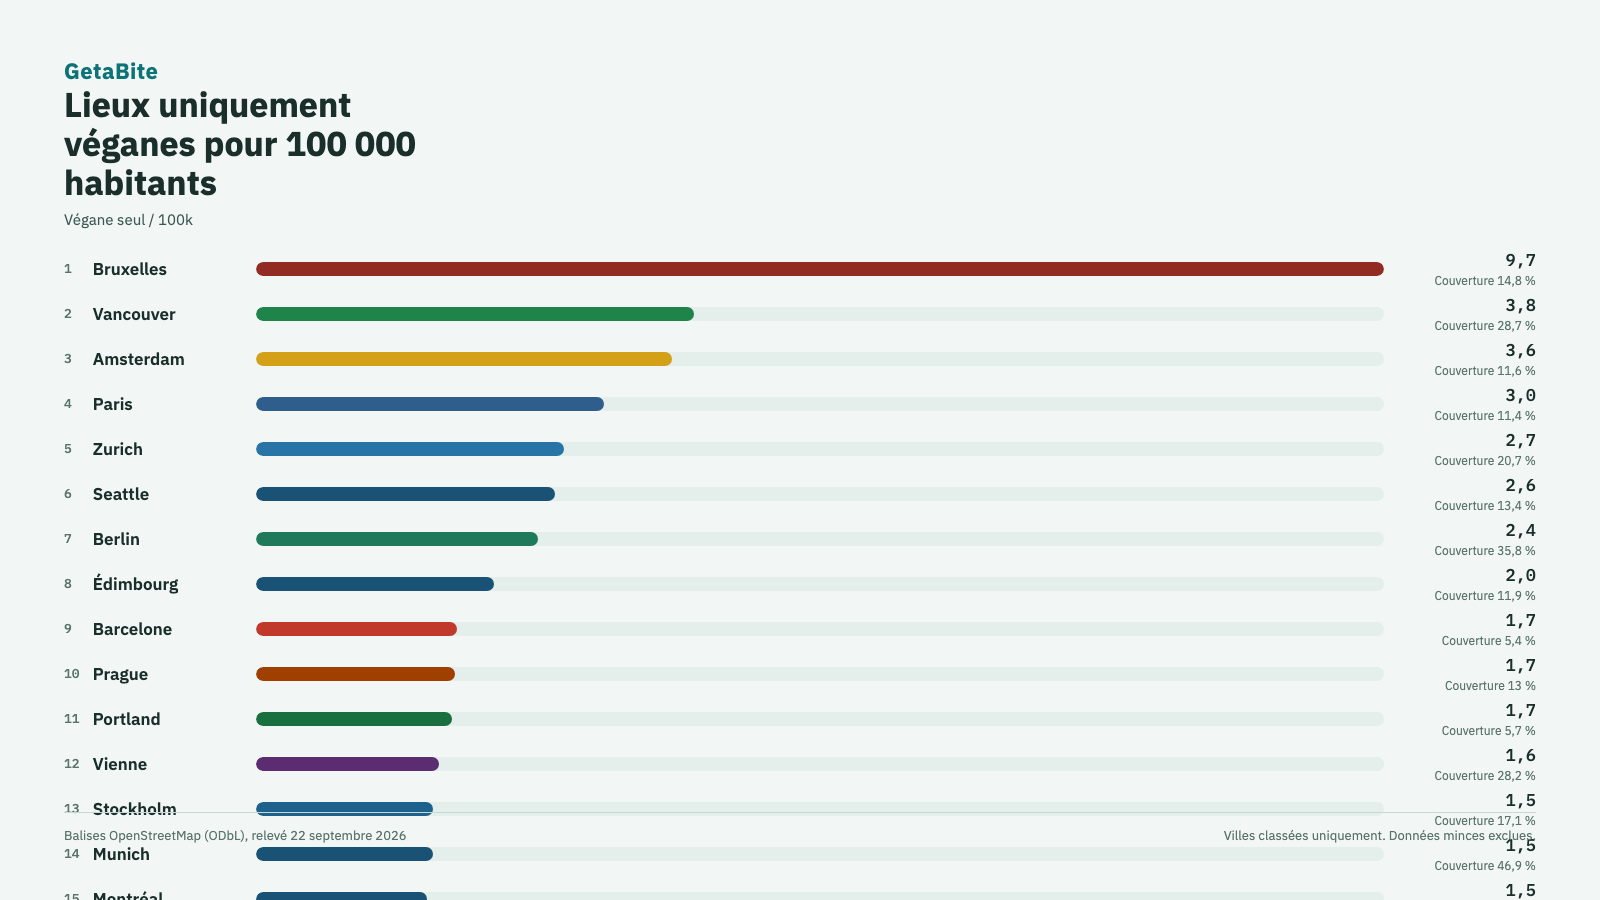
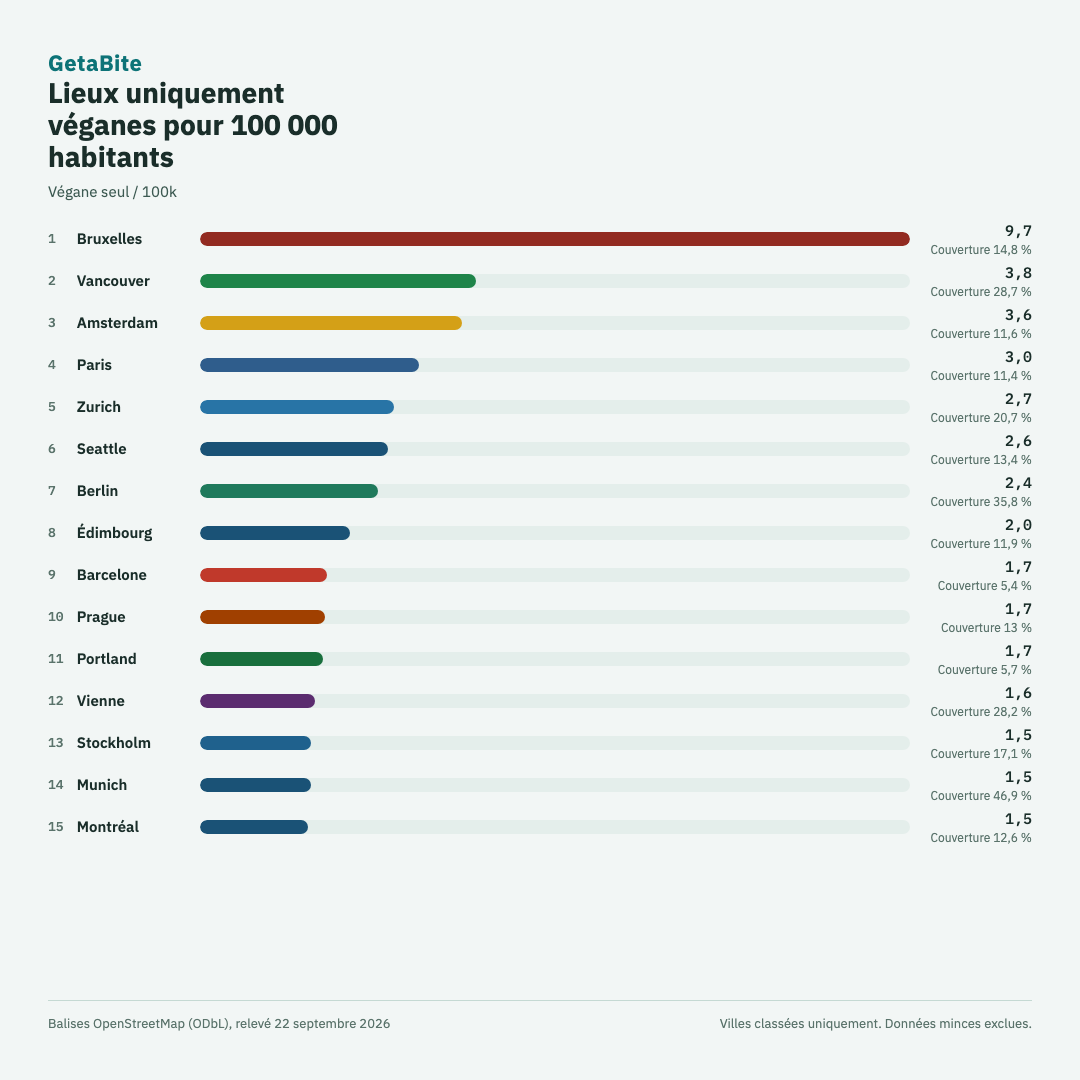
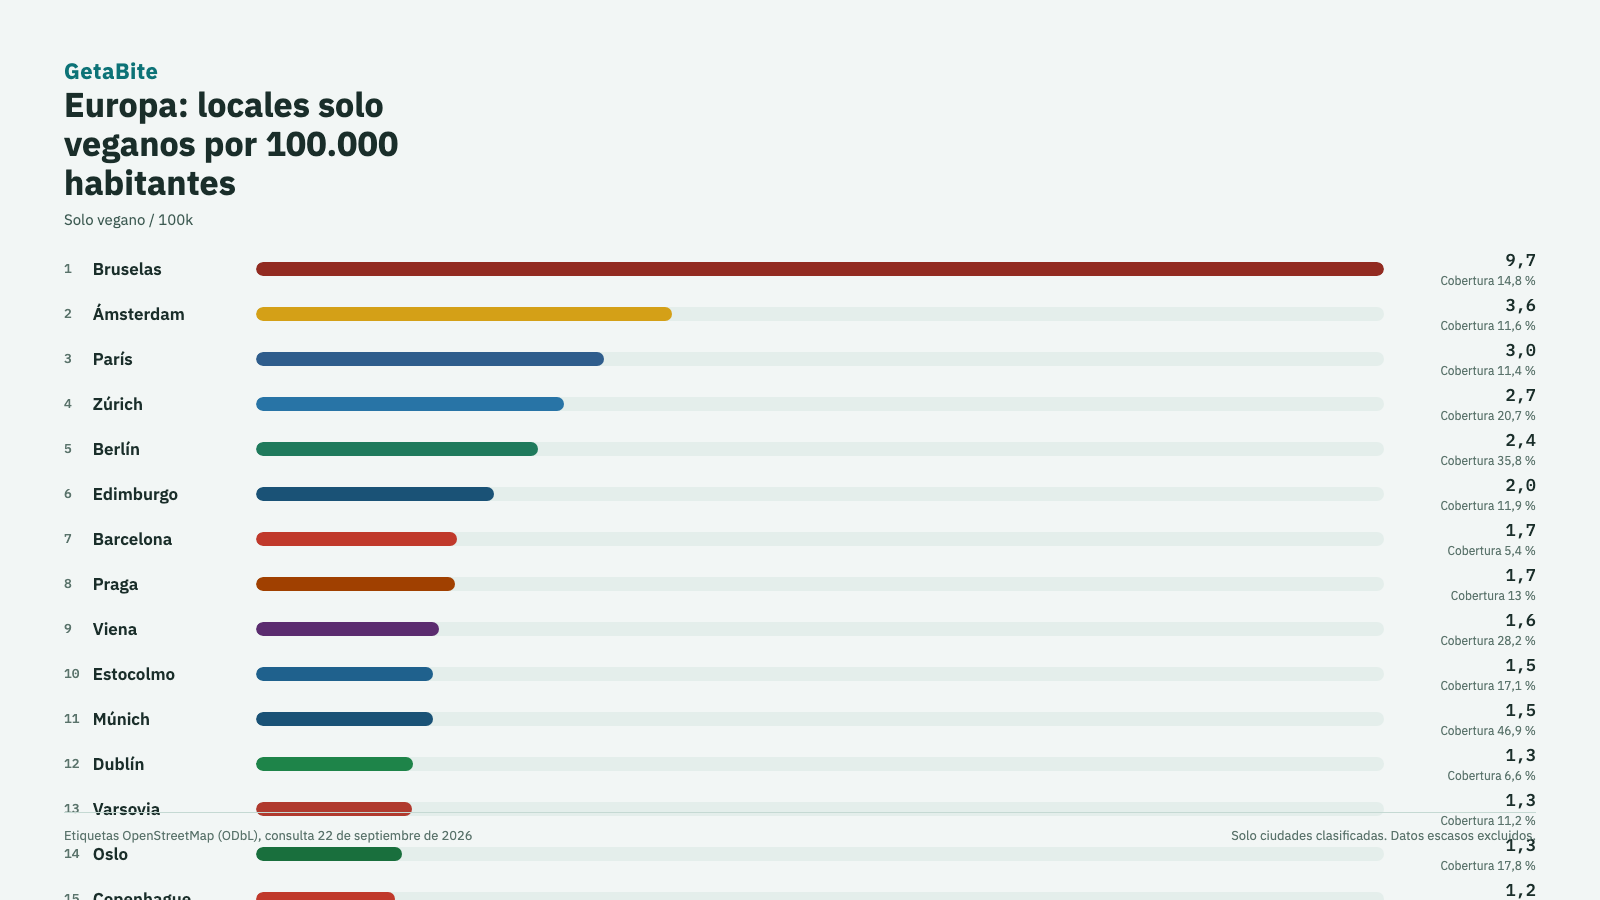
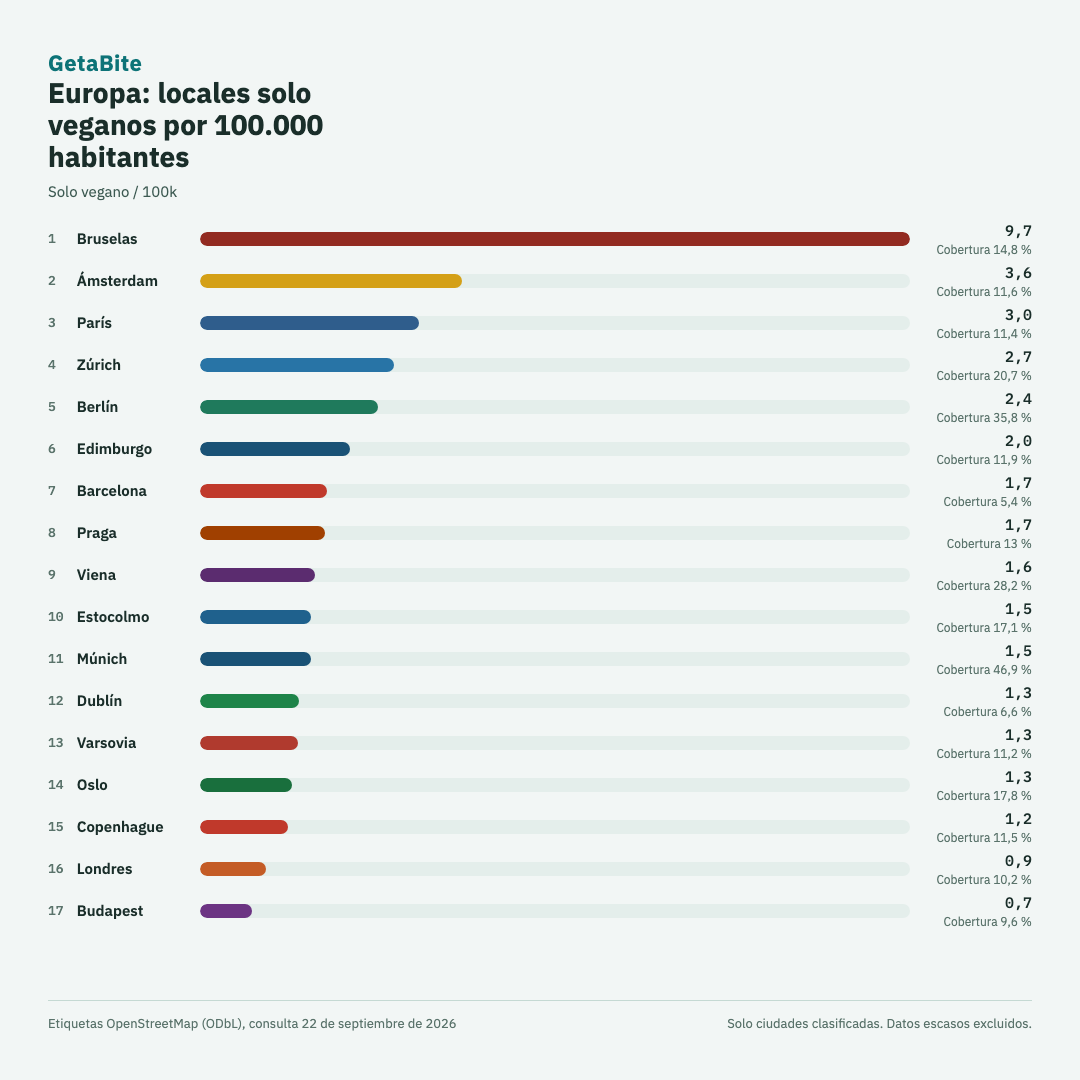
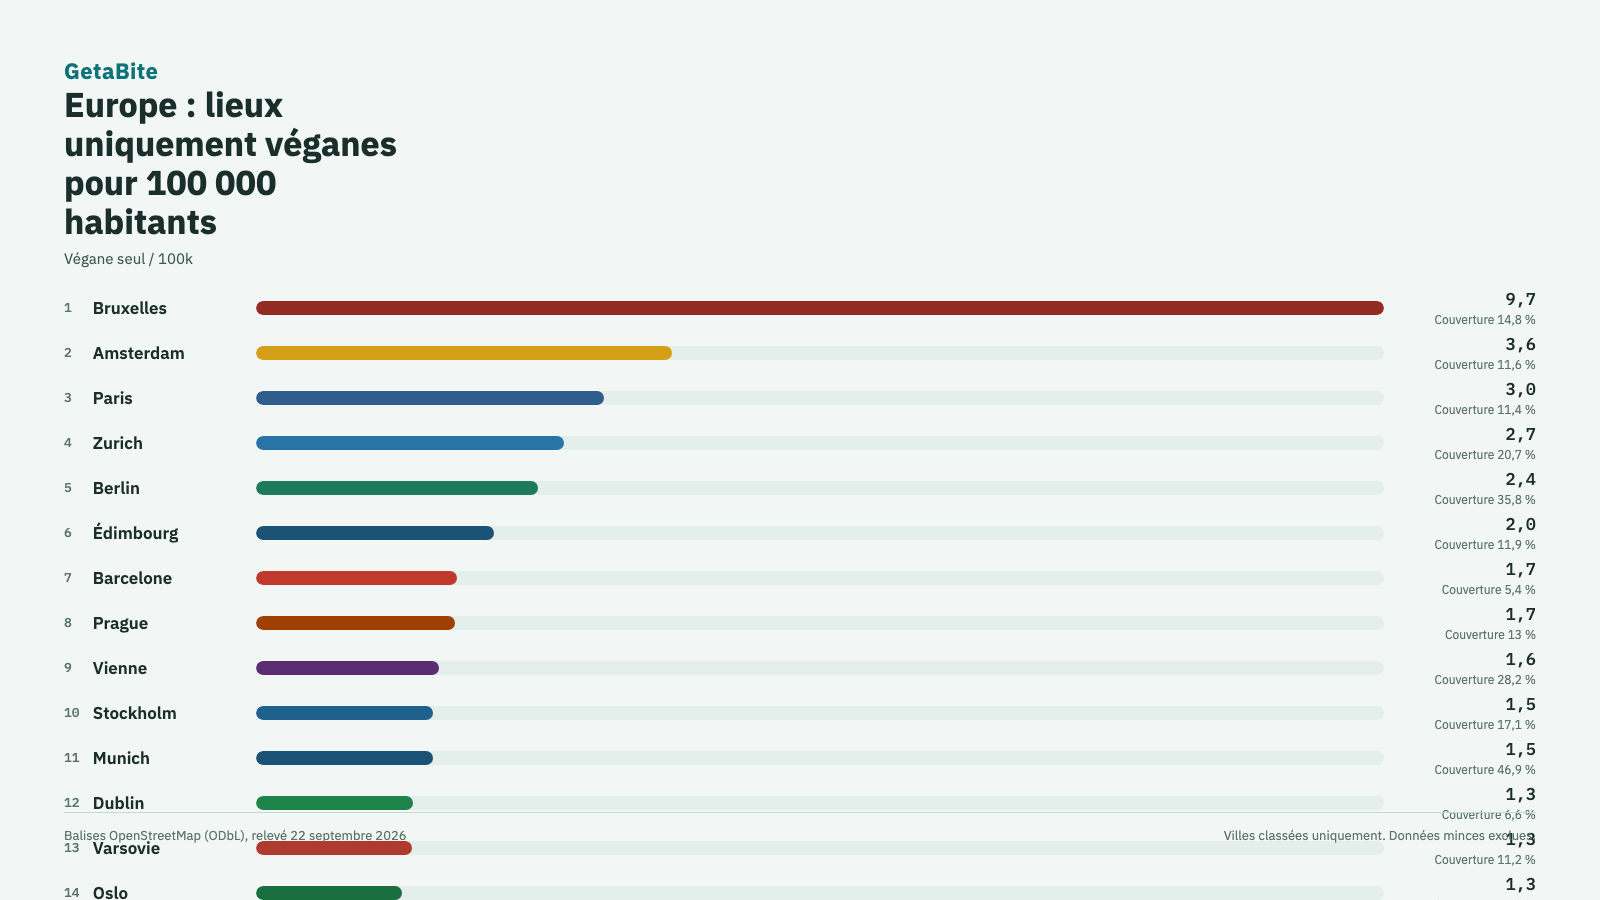
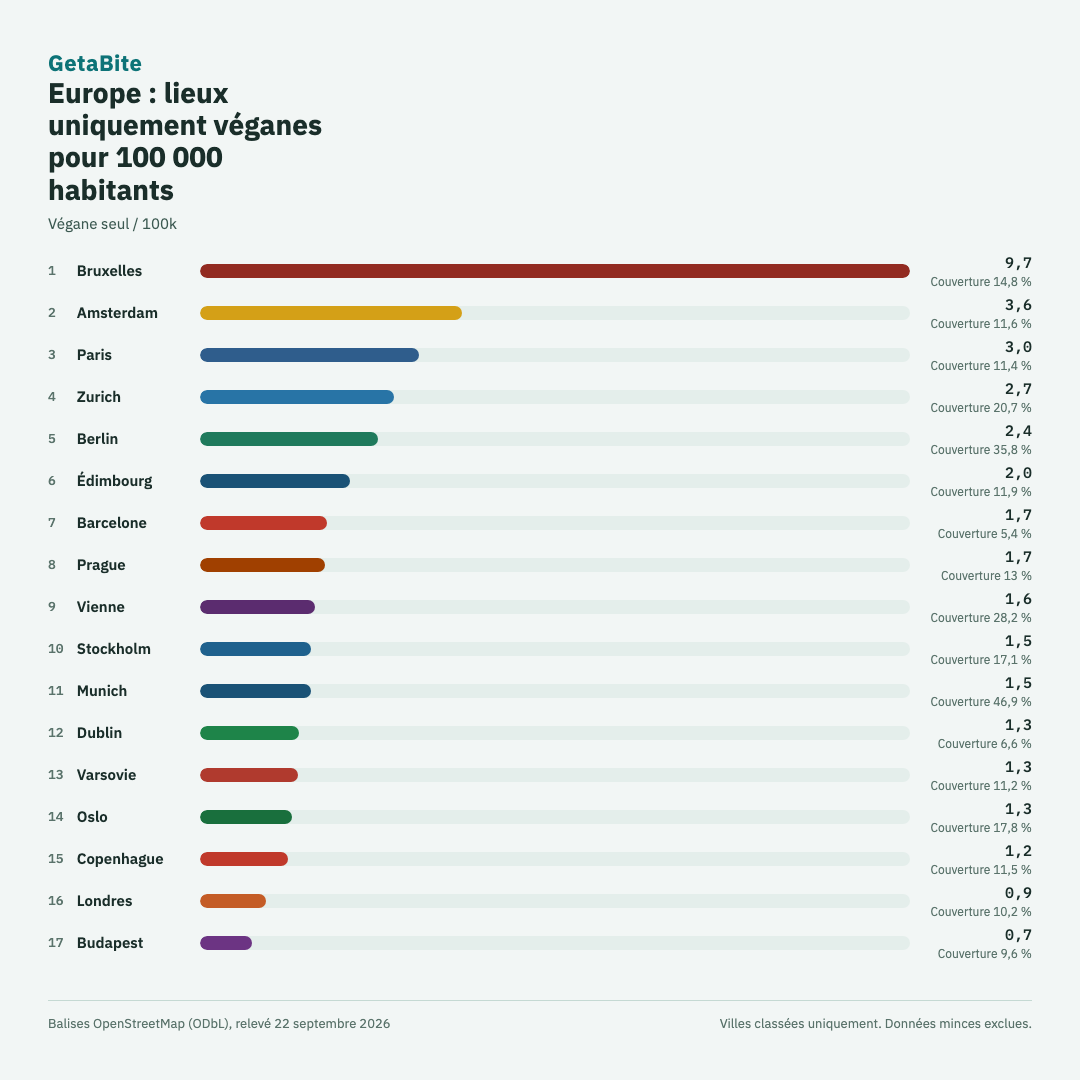
Among ranked cities, Brussels has the highest density of vegan-only tagged places per 100,000 people in this set, followed by Vancouver and Amsterdam.
Tagging coverage varies widely. Several large European cities show relatively dense diet tagging. Many cities in Asia, Africa, and South America in this set stay below the 5 percent coverage threshold and therefore stay unranked.
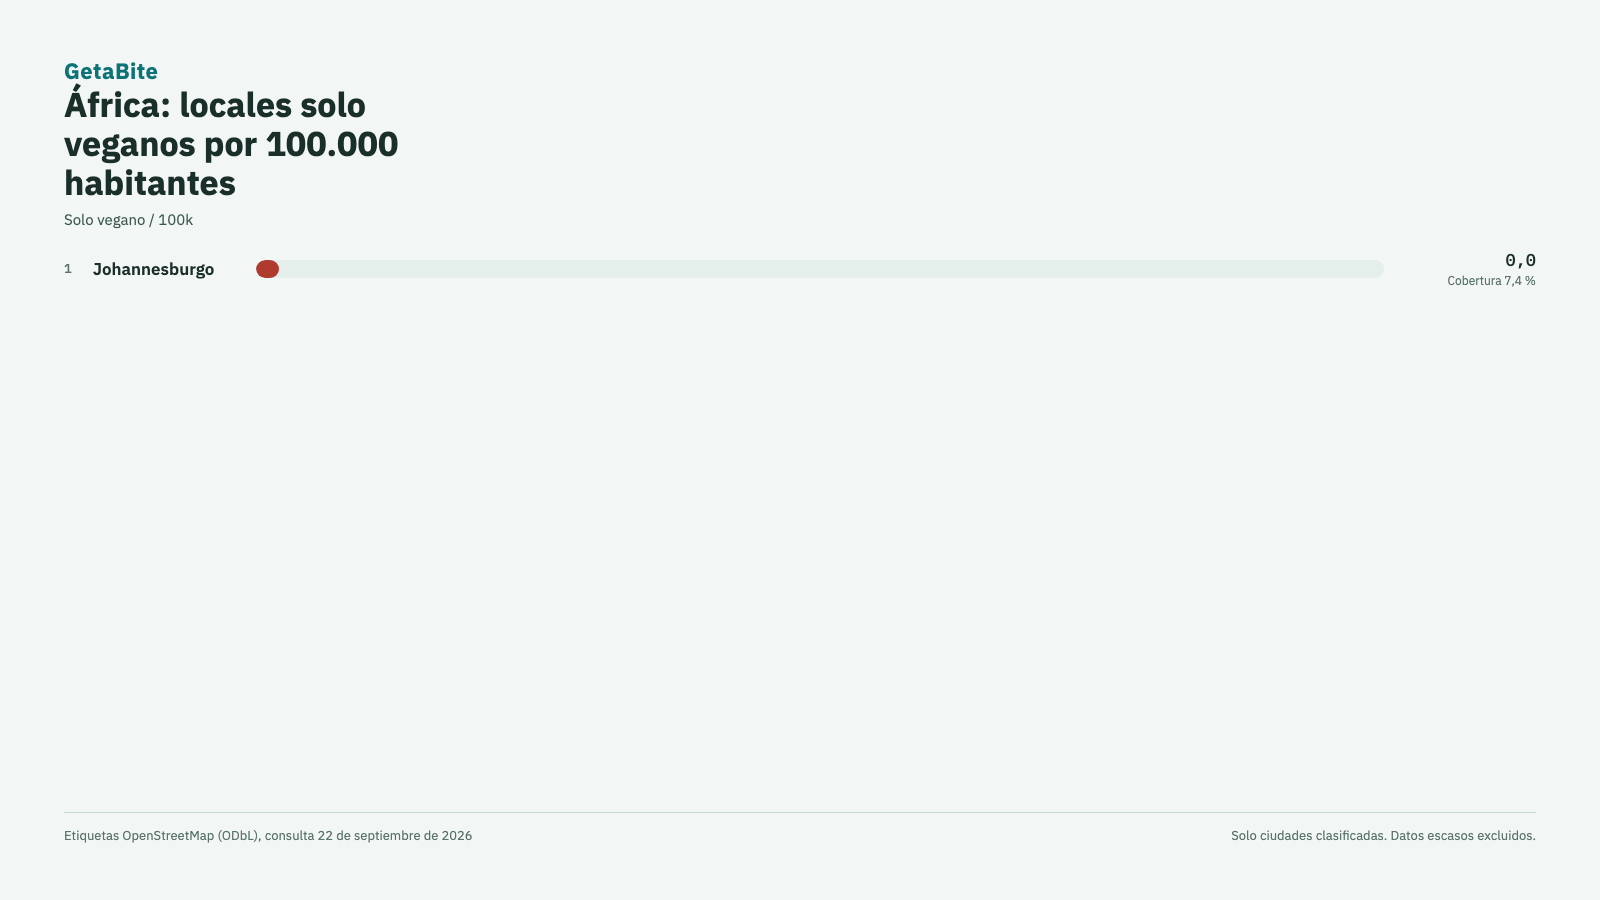
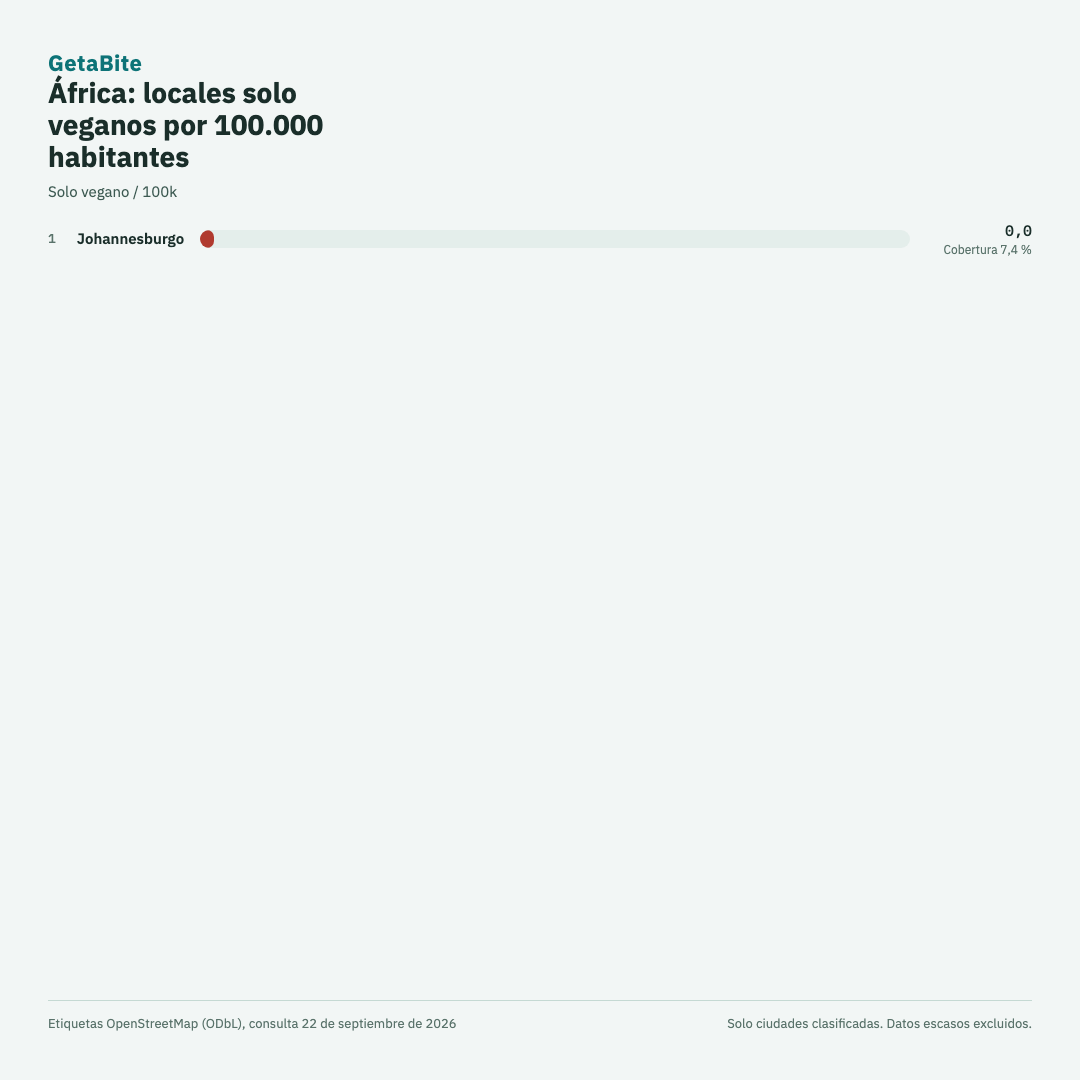
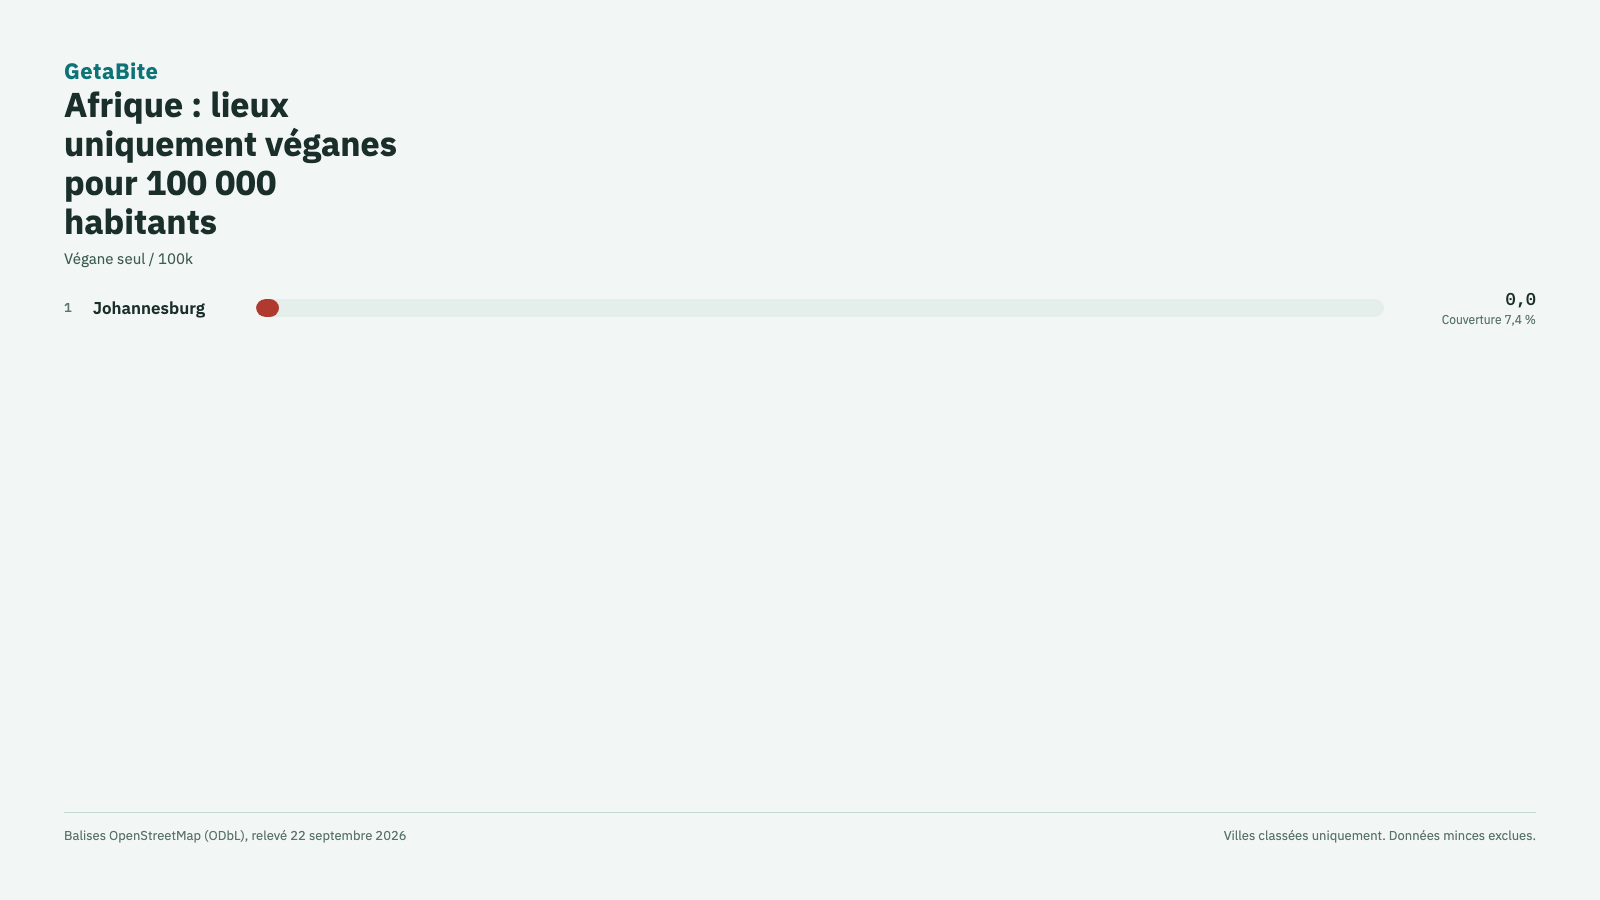
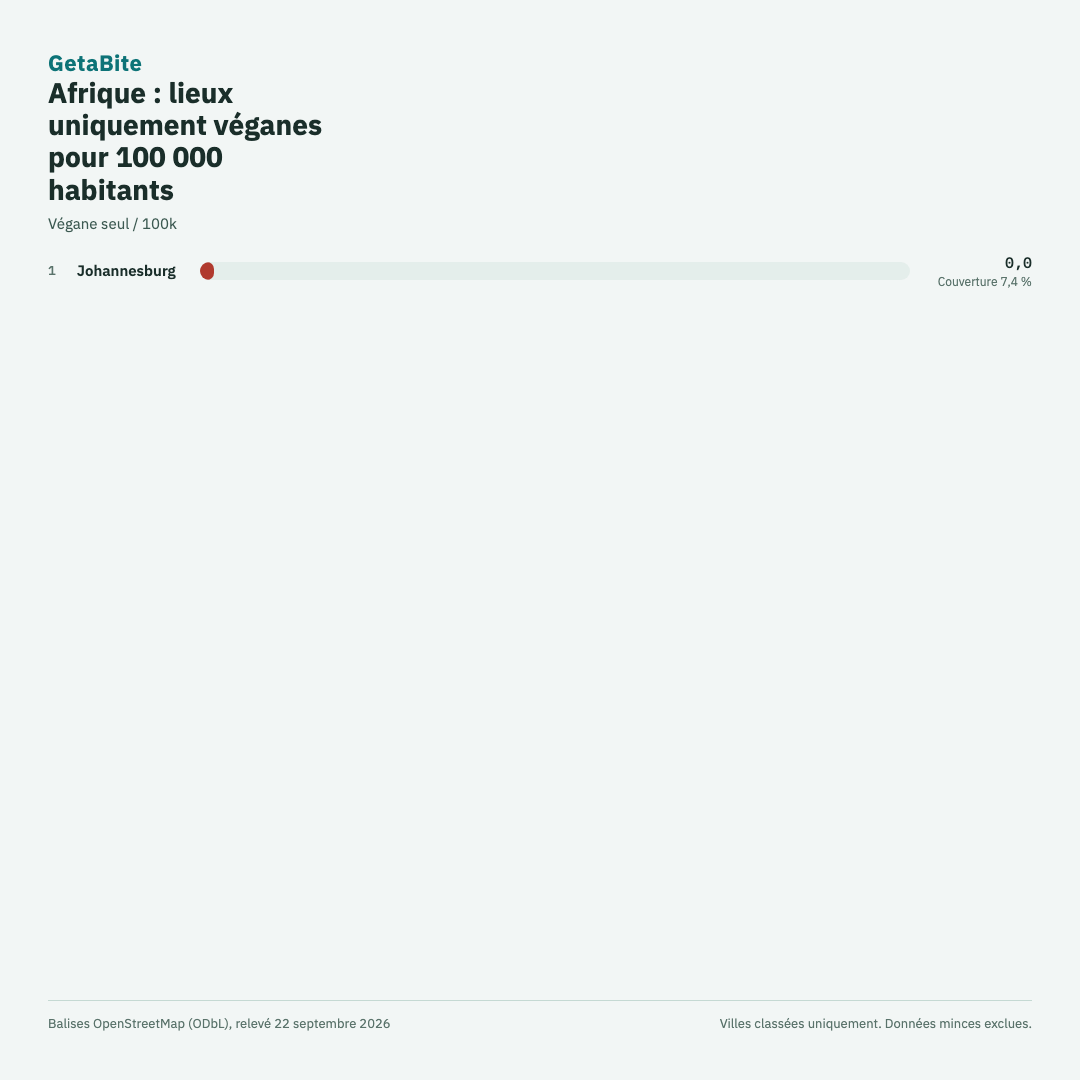
South America has no ranked city in this snapshot. Africa has one ranked city (Johannesburg).
Charts
PNG downloads in landscape and square, in English, German, Spanish, and French.
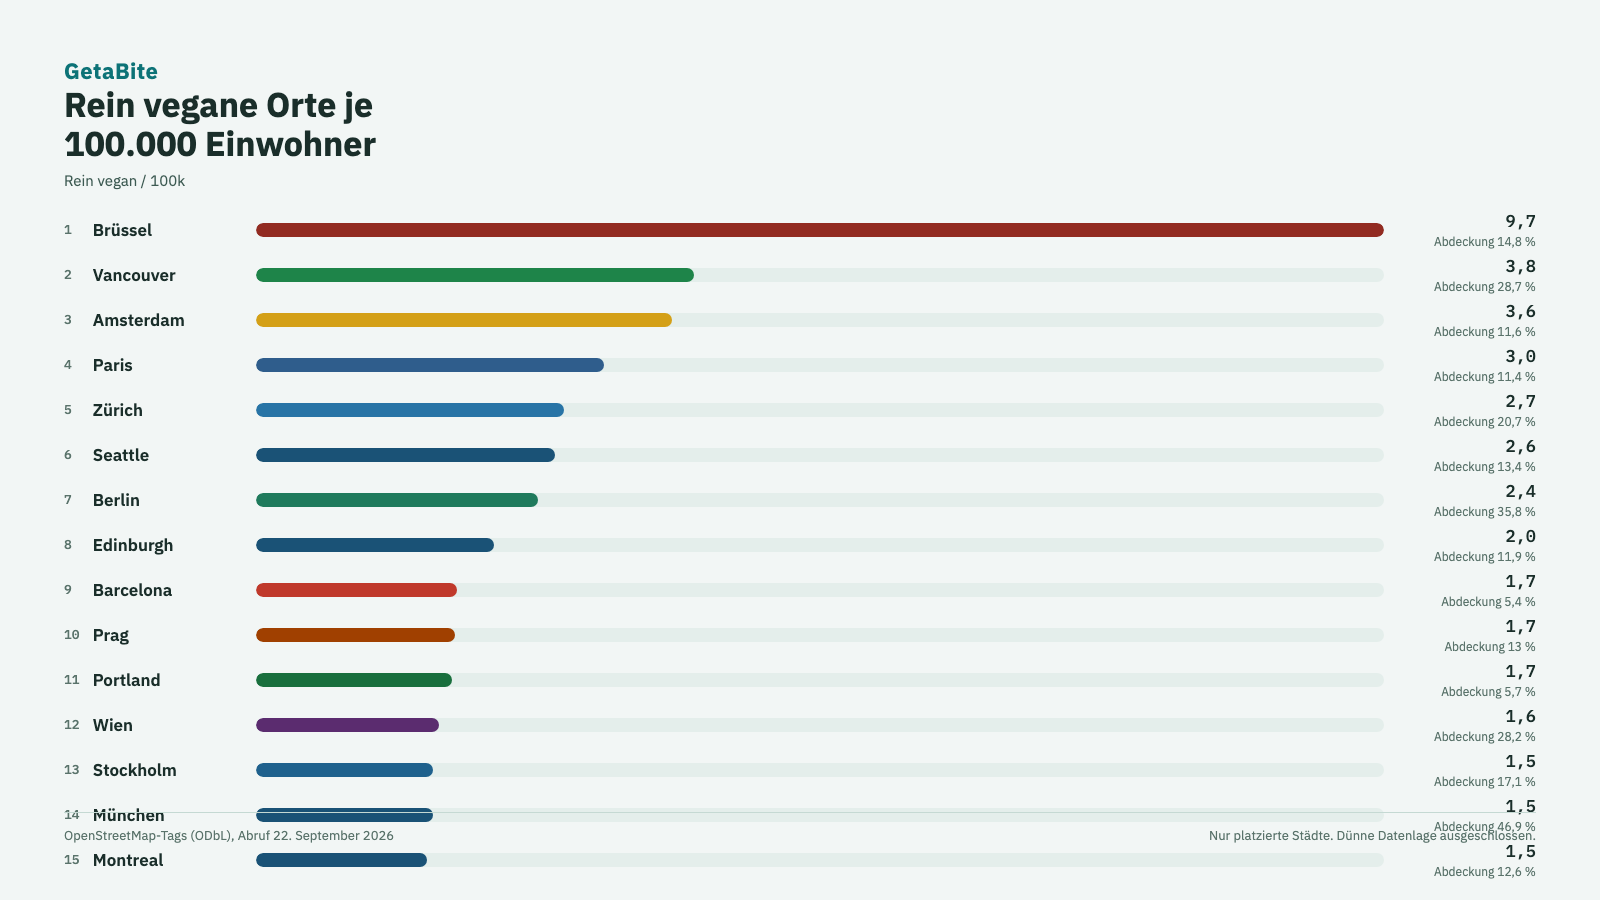
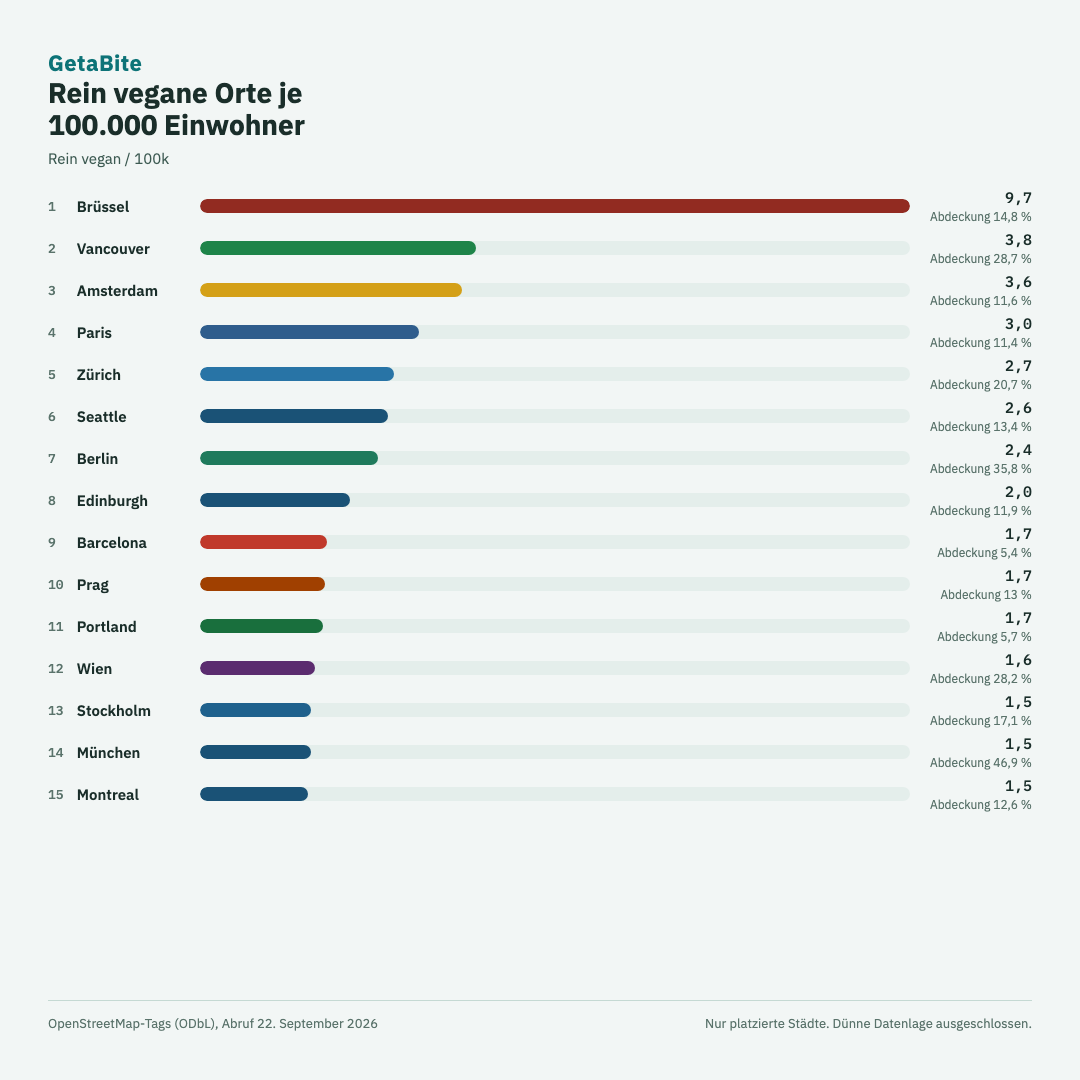
World ranking (top 15 by vegan-only places per 100,000 people)
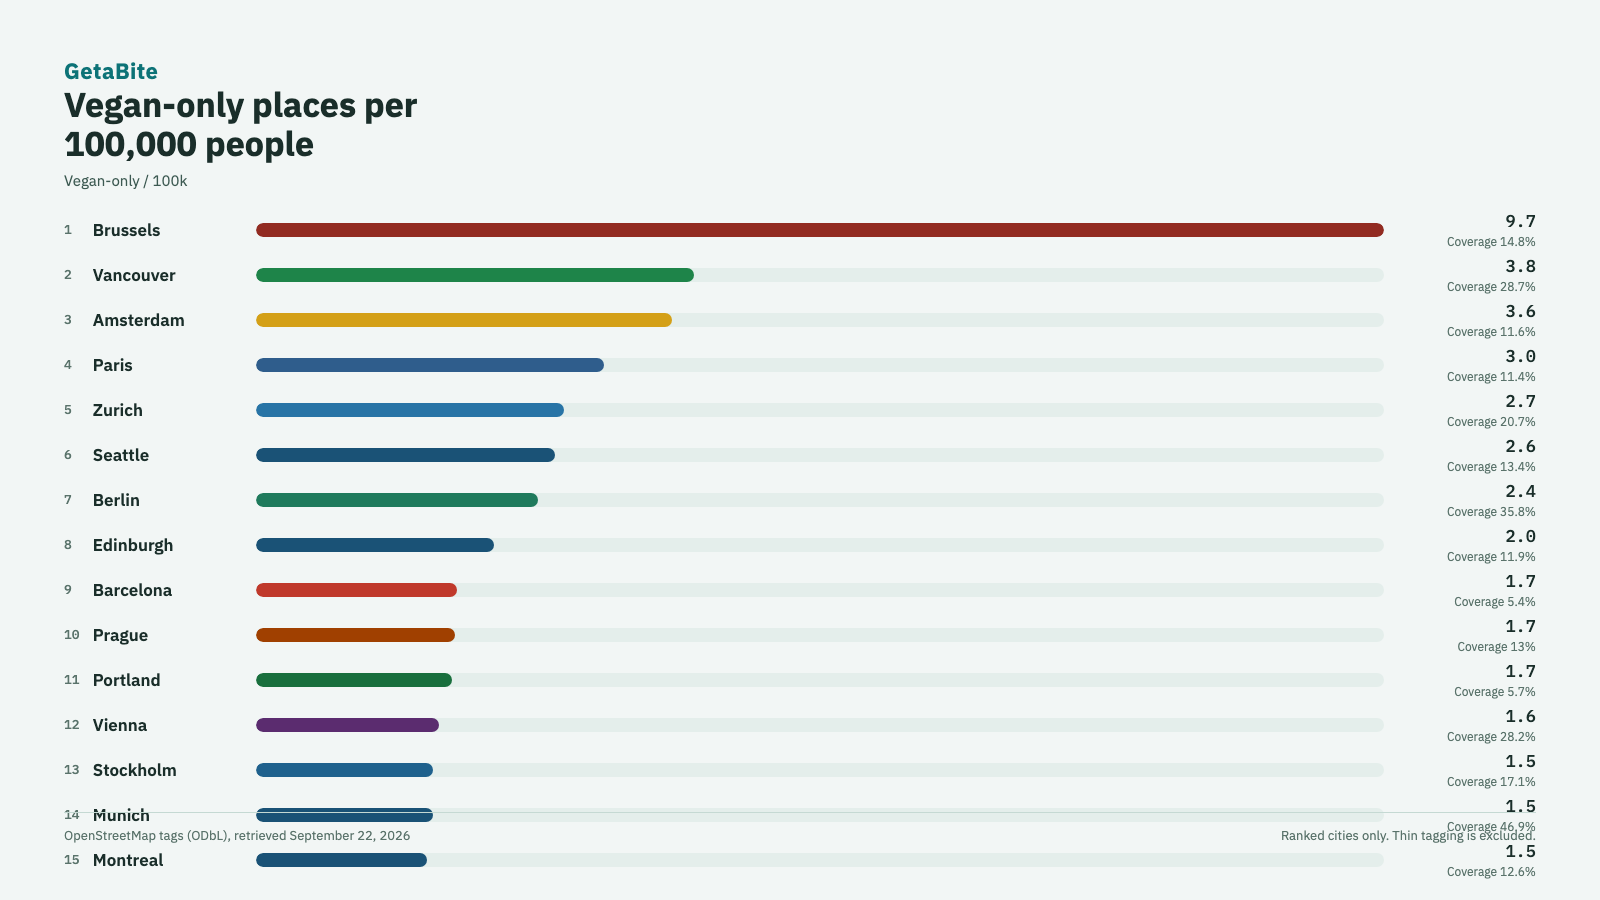
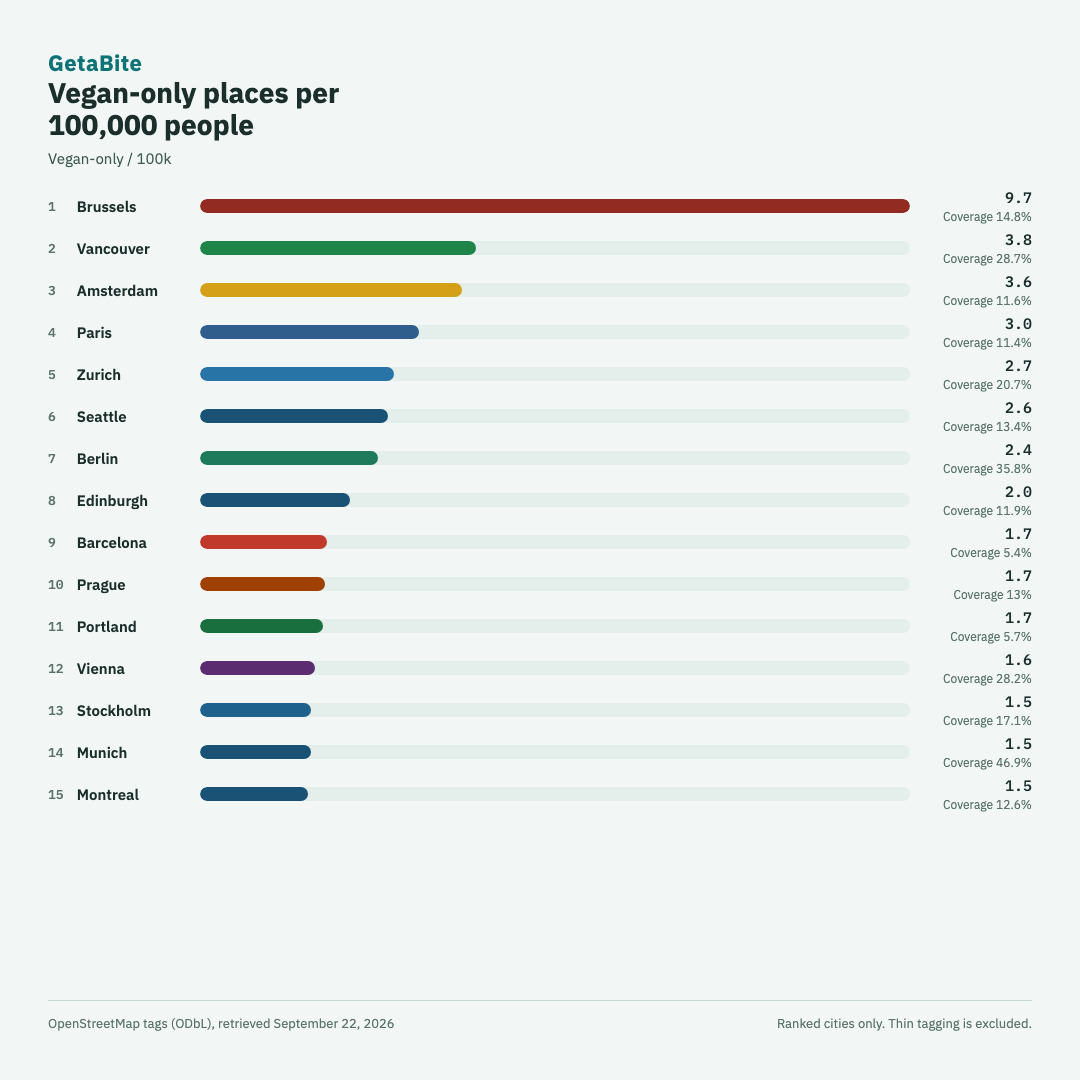
de Landscape · de Square · es Landscape · es Square · fr Landscape · fr Square
Europe ranking
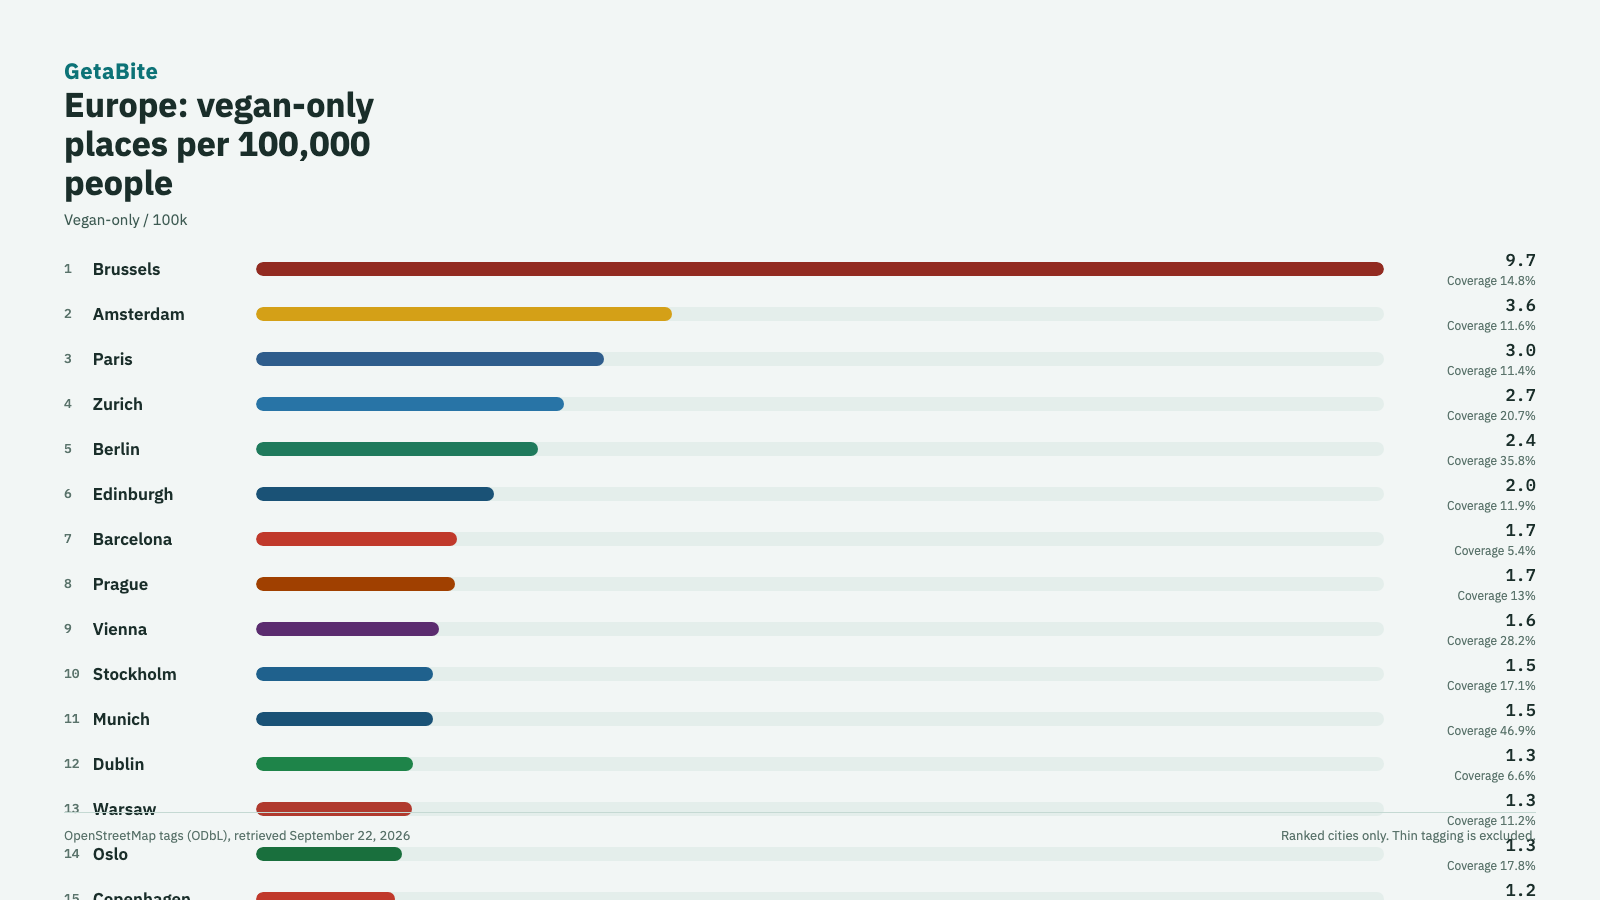
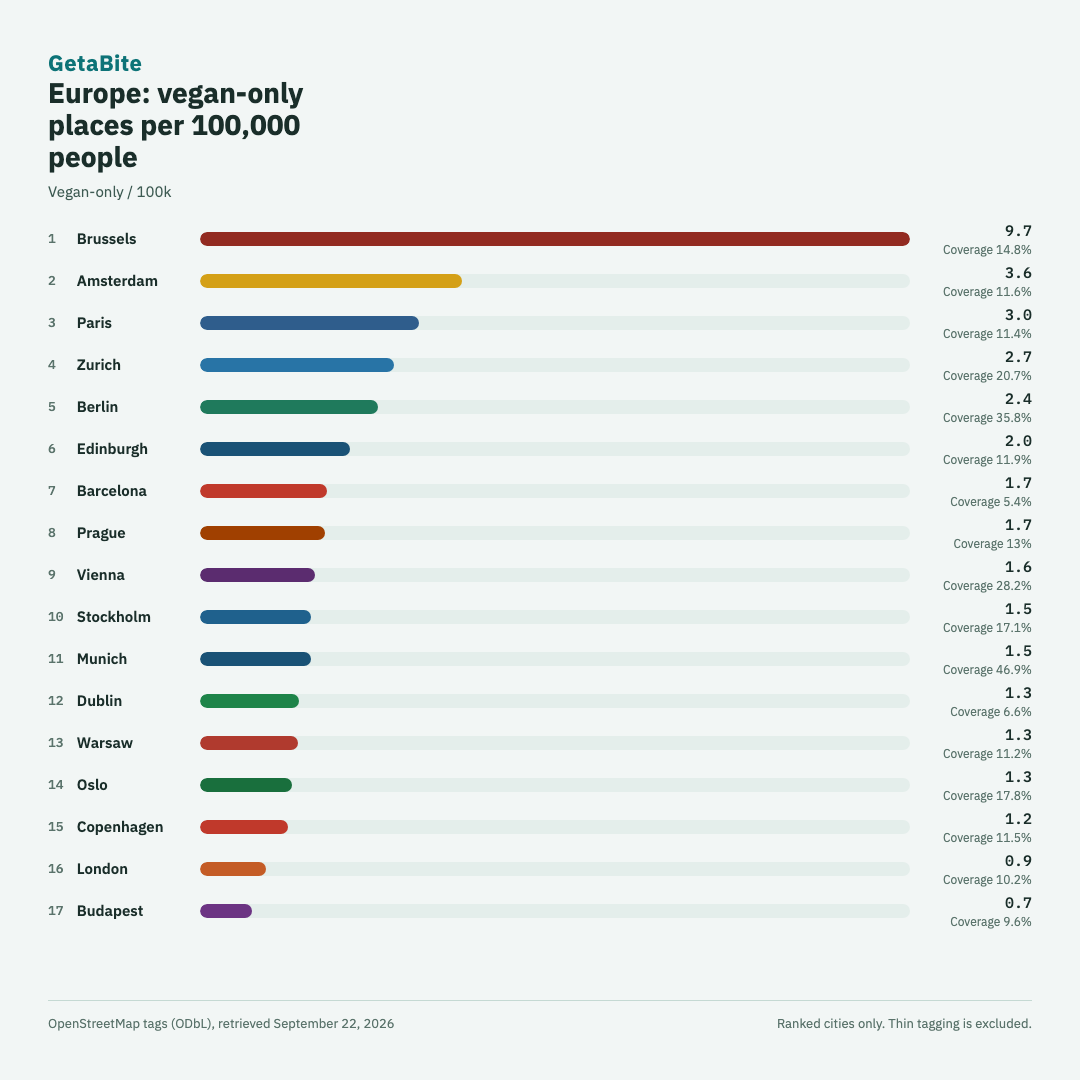
de Landscape · de Square · es Landscape · es Square · fr Landscape · fr Square
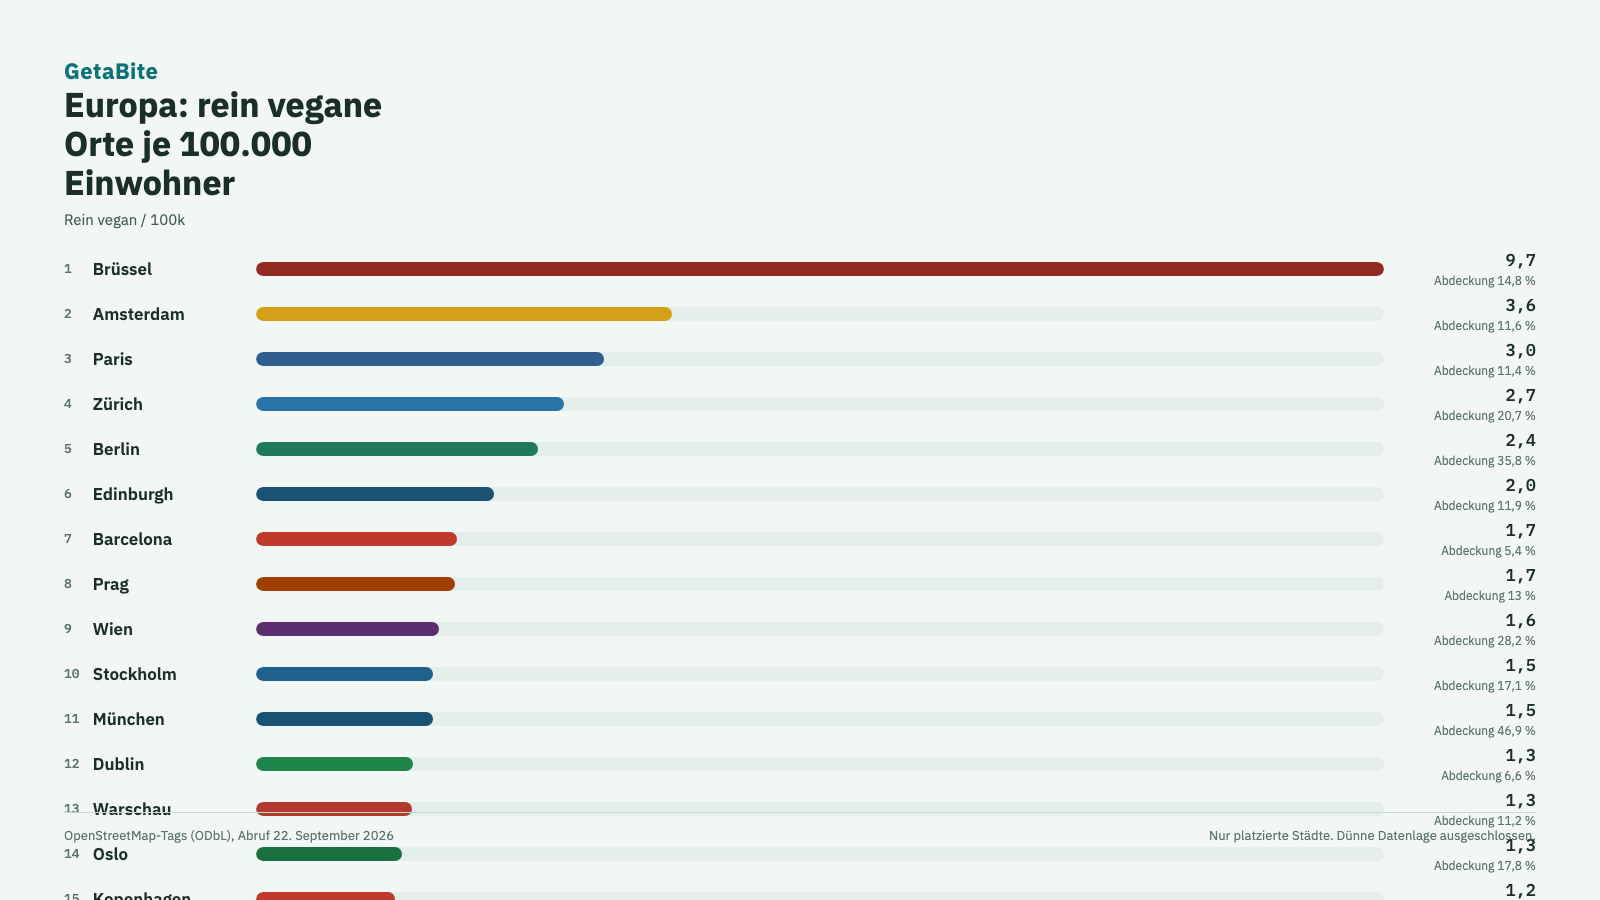
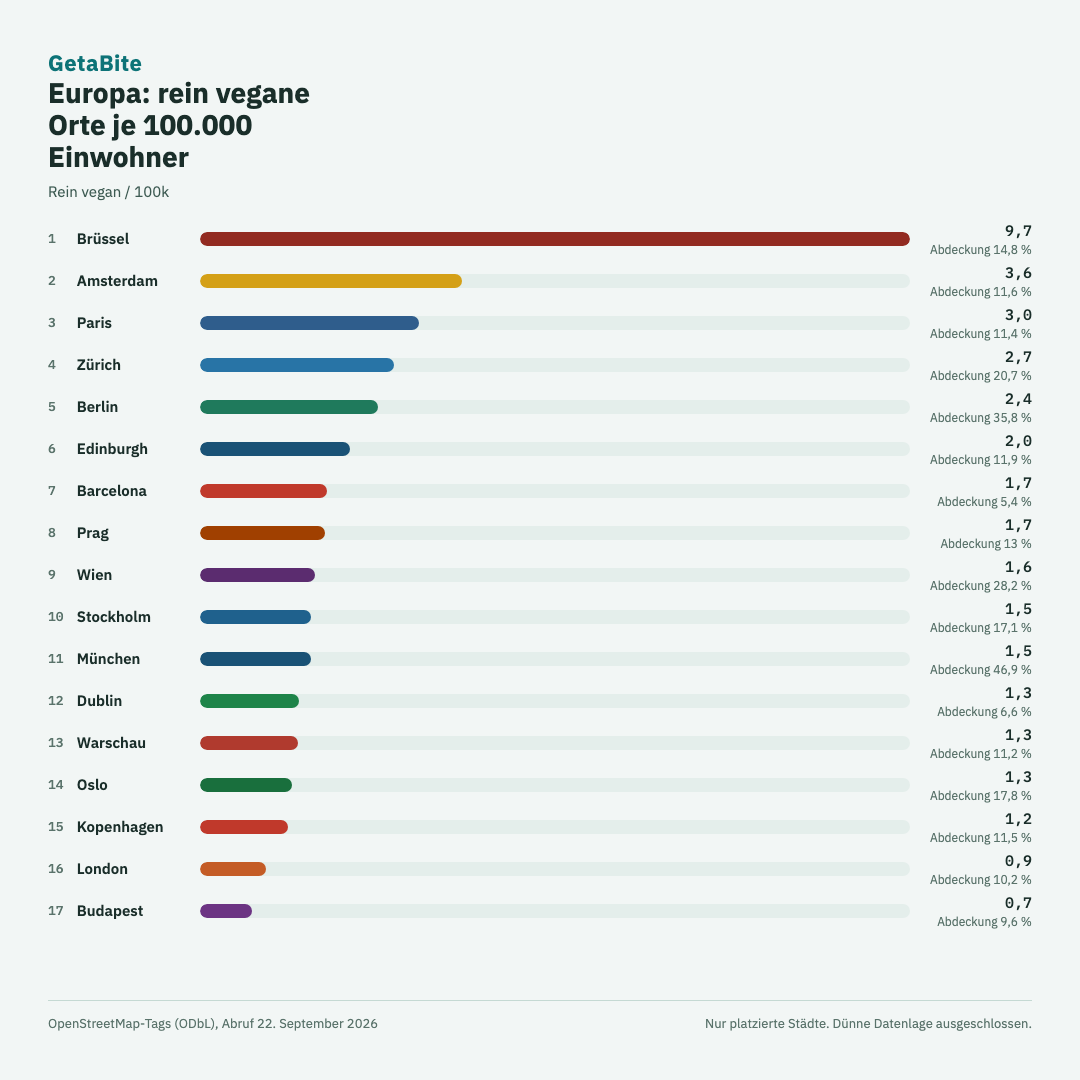
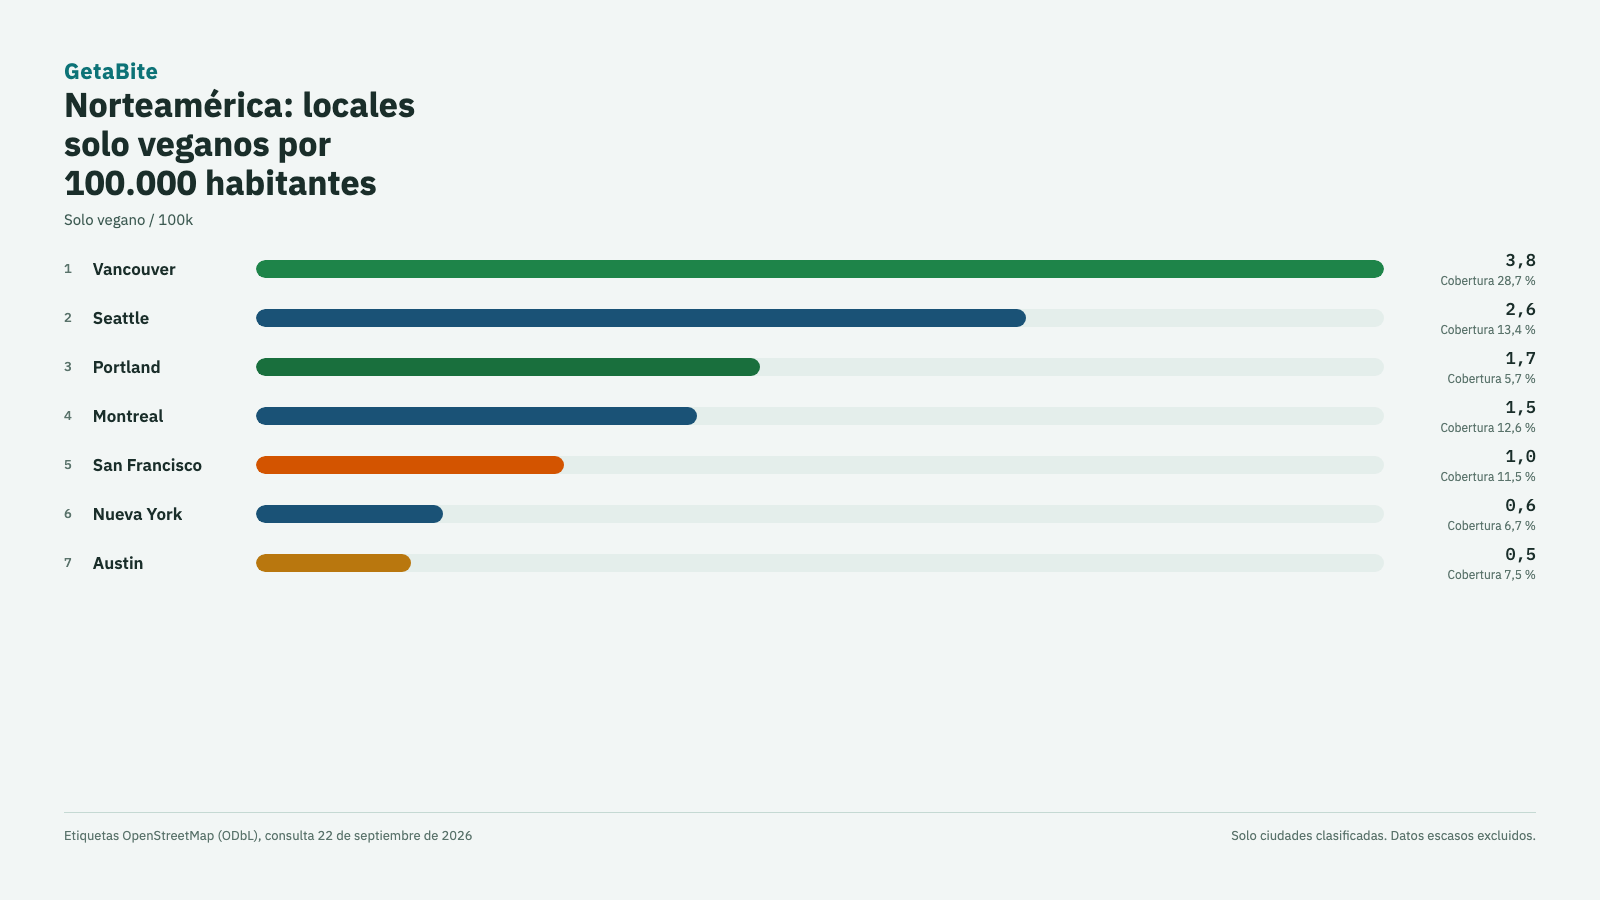
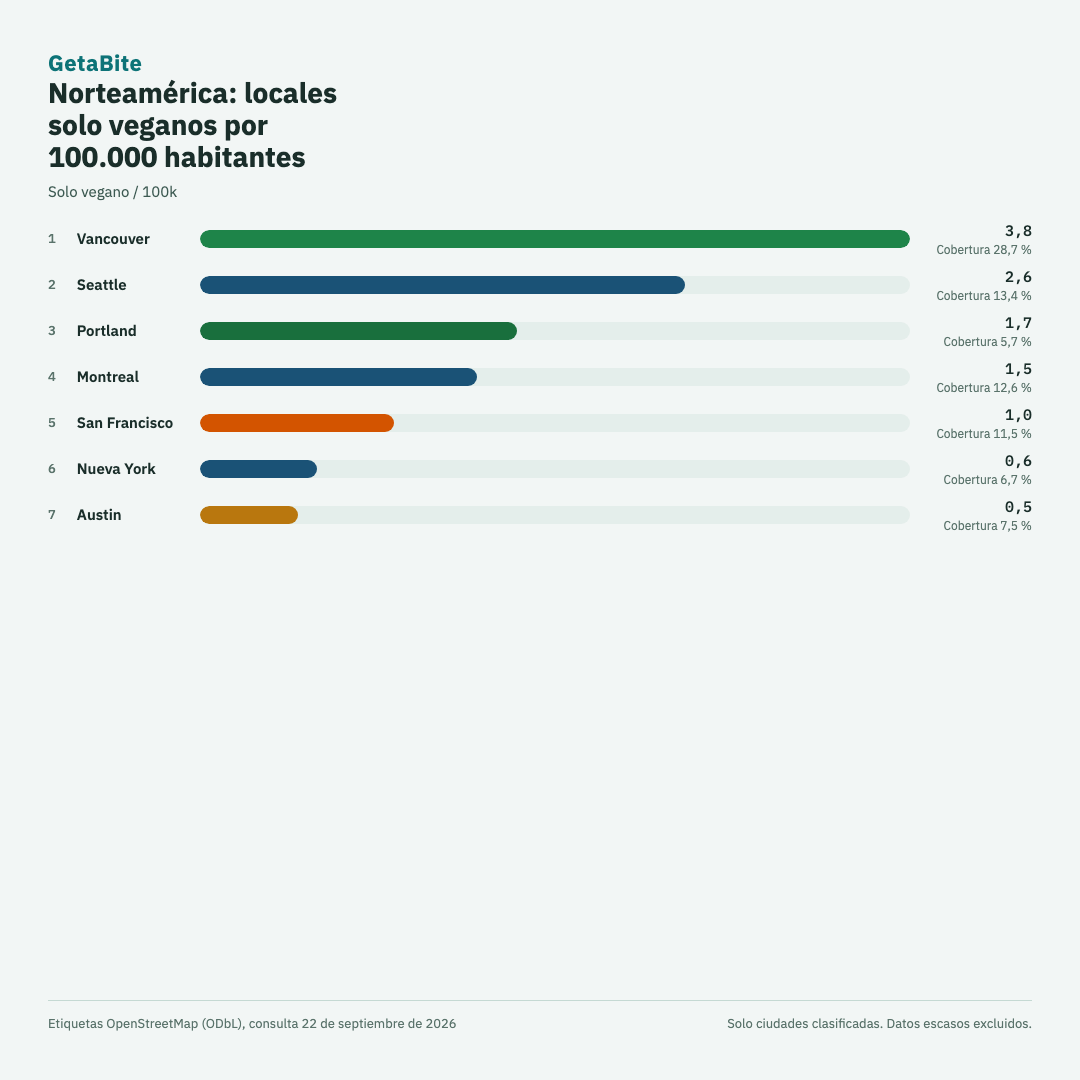
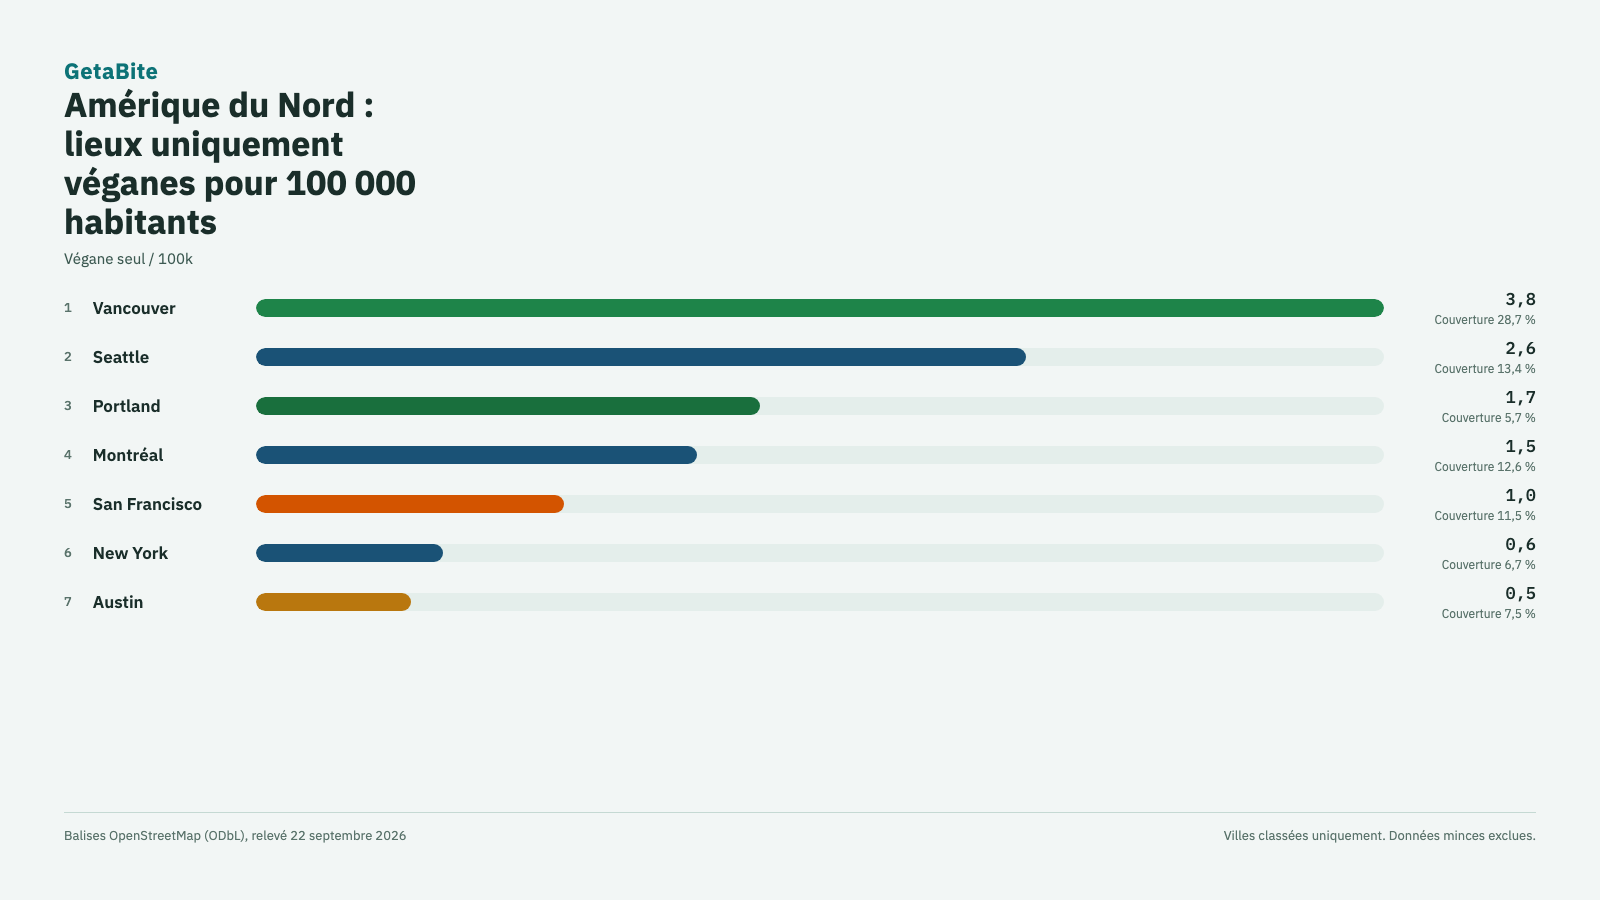
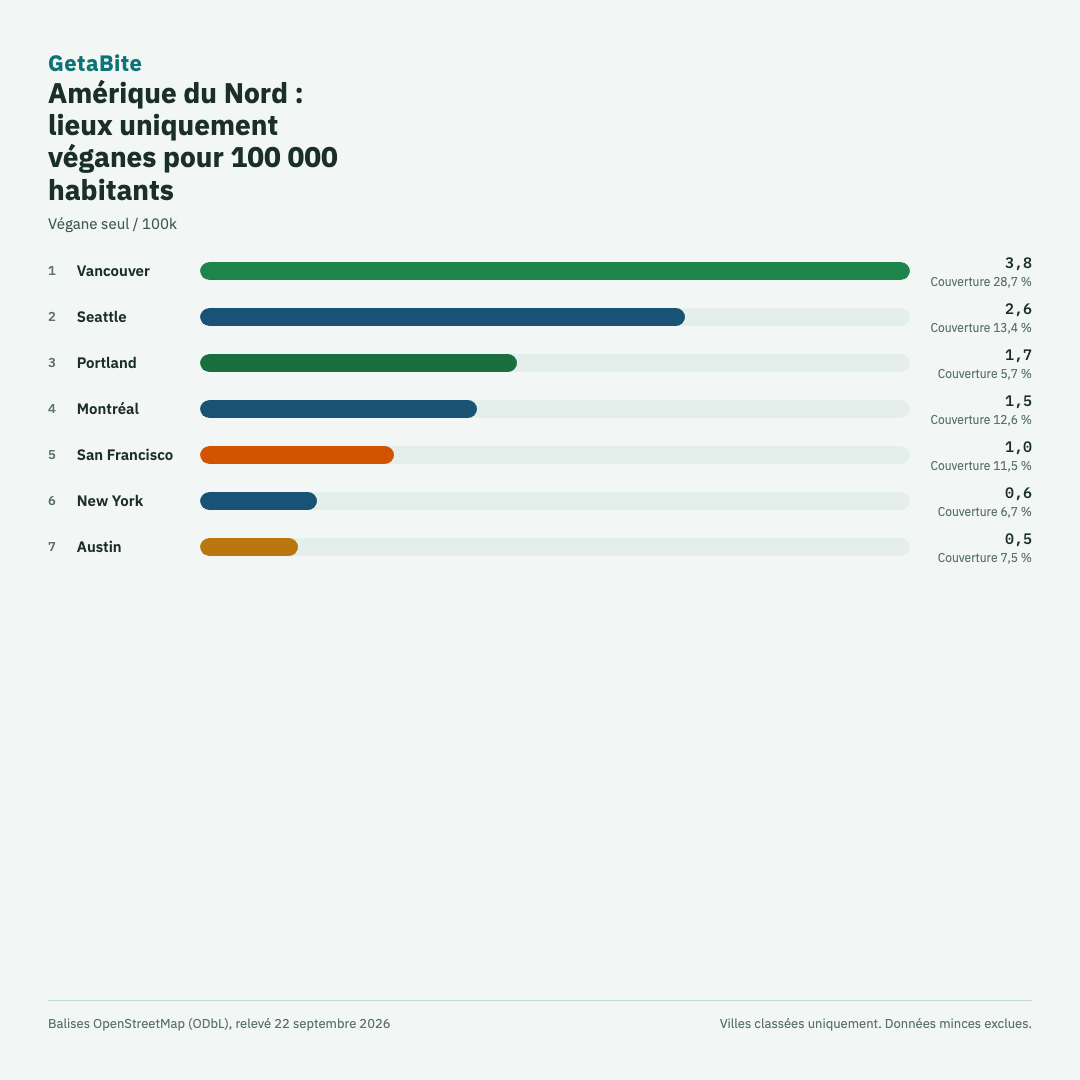
North America ranking
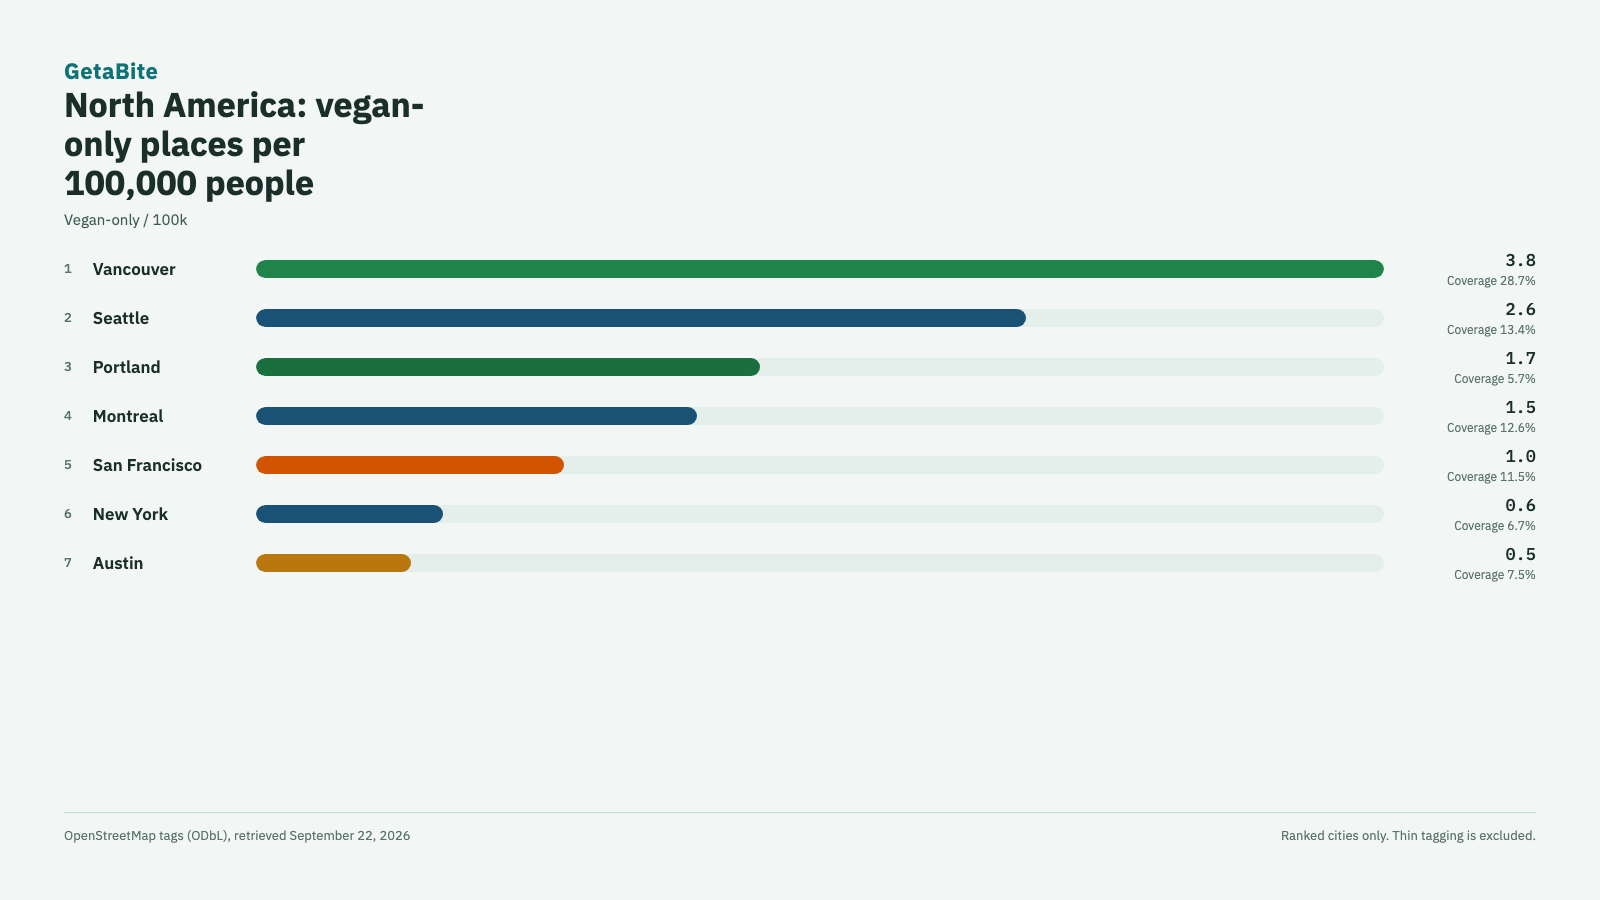
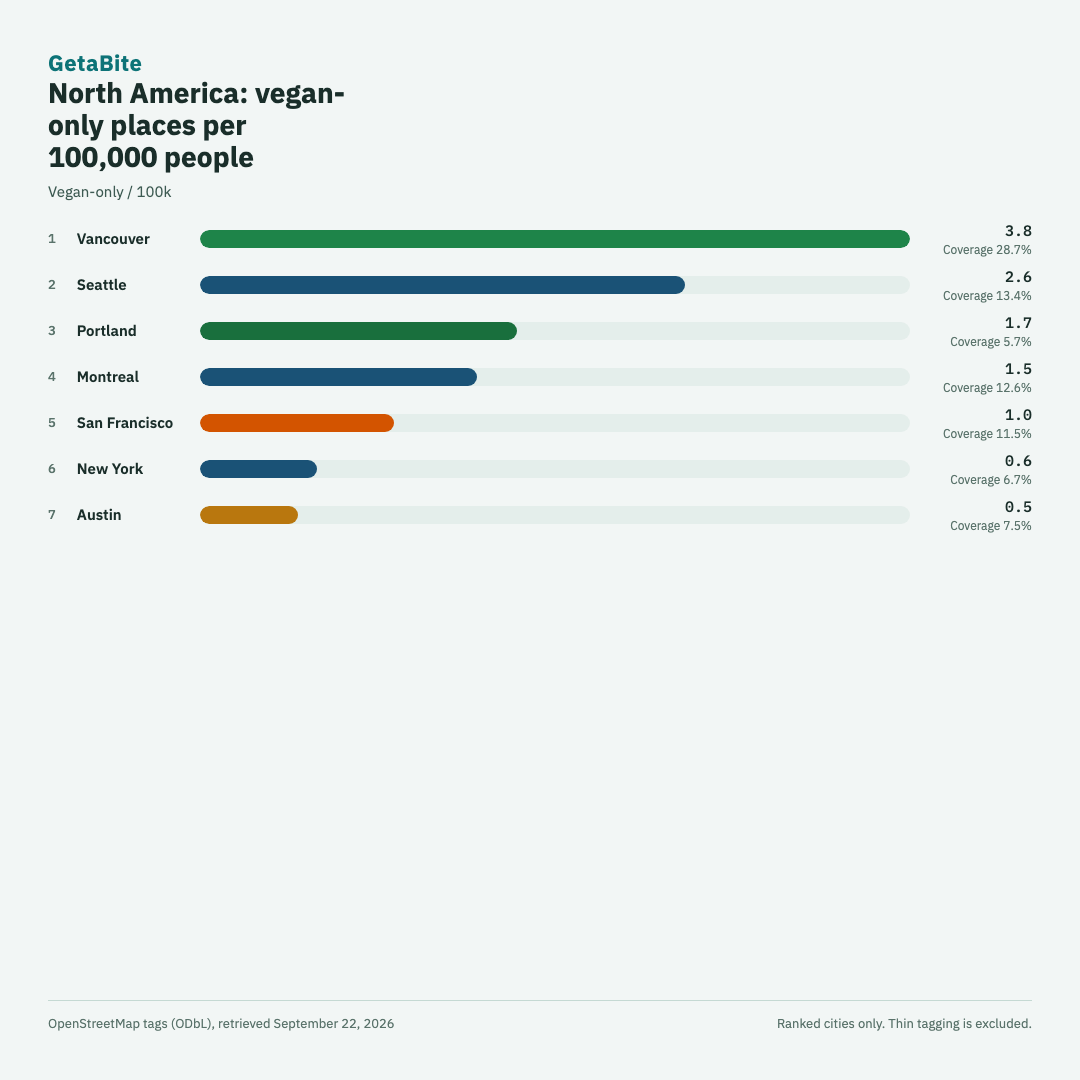
de Landscape · de Square · es Landscape · es Square · fr Landscape · fr Square
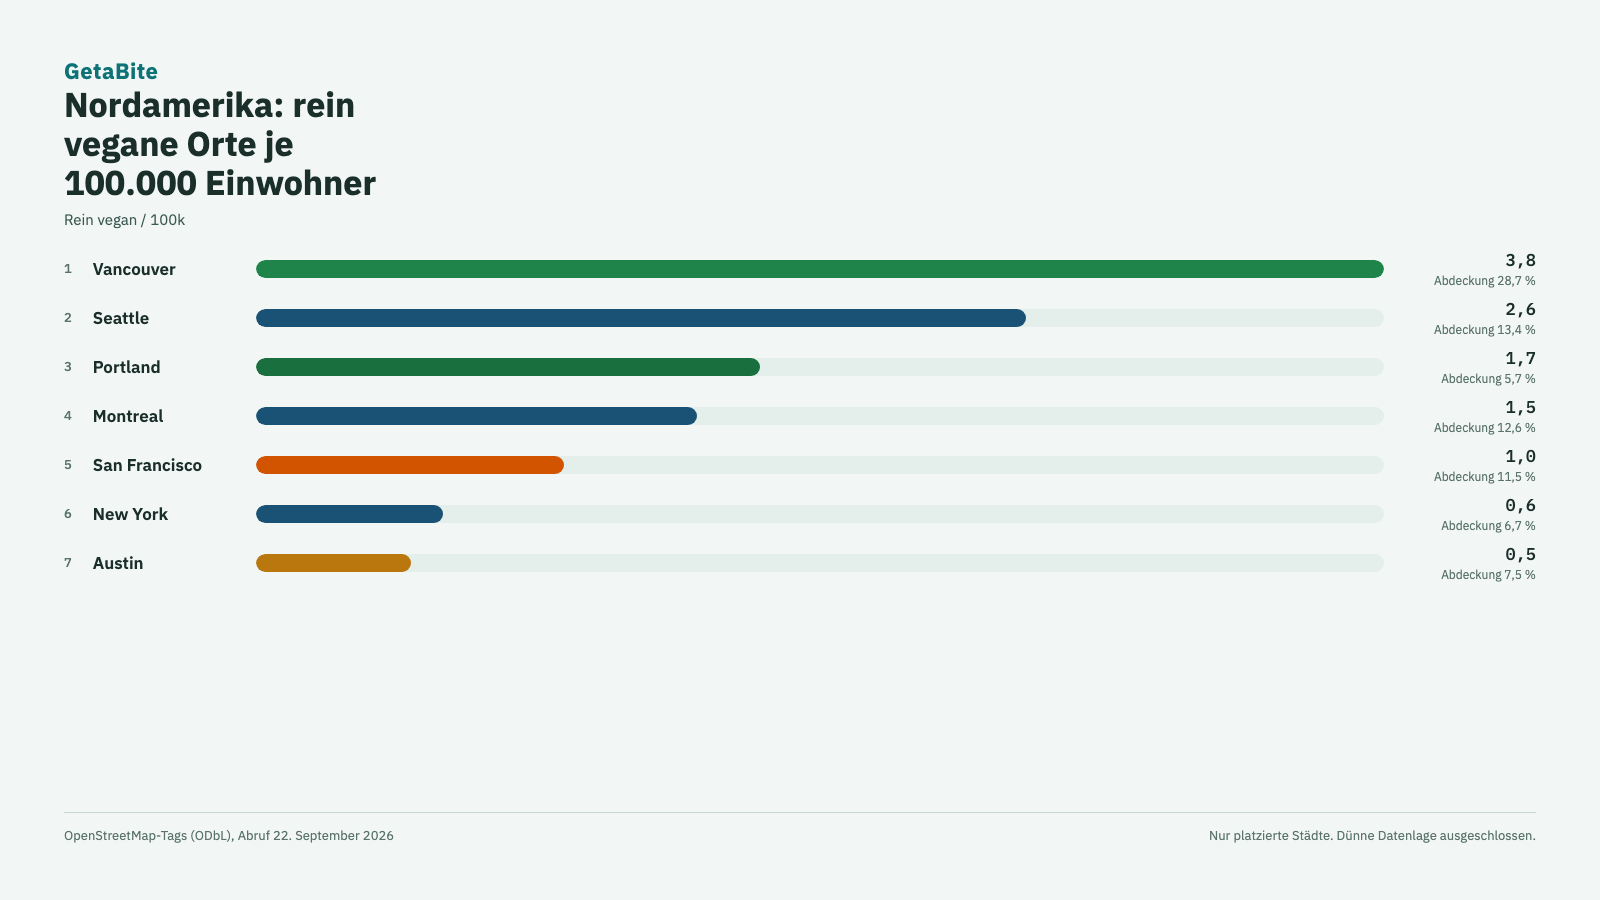
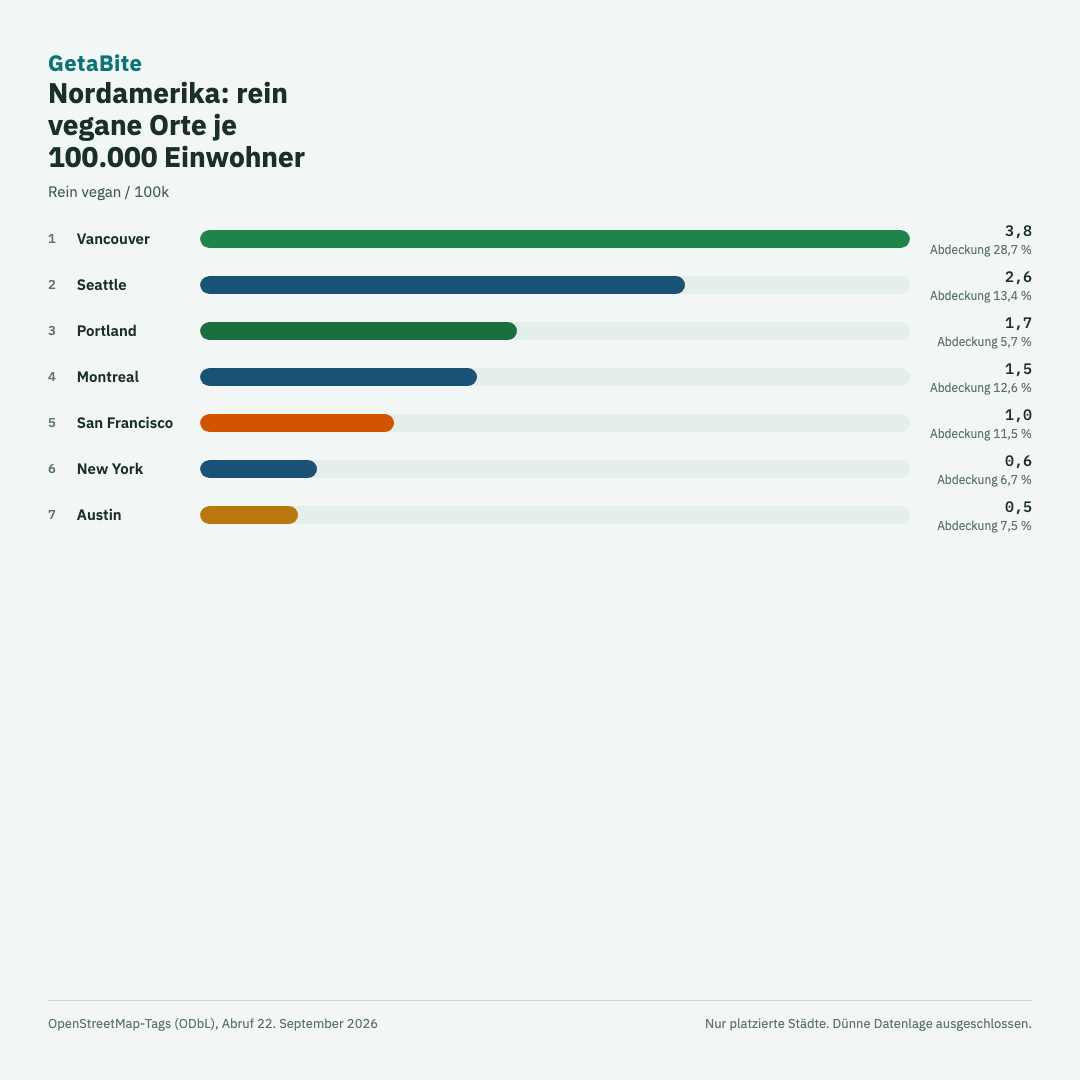
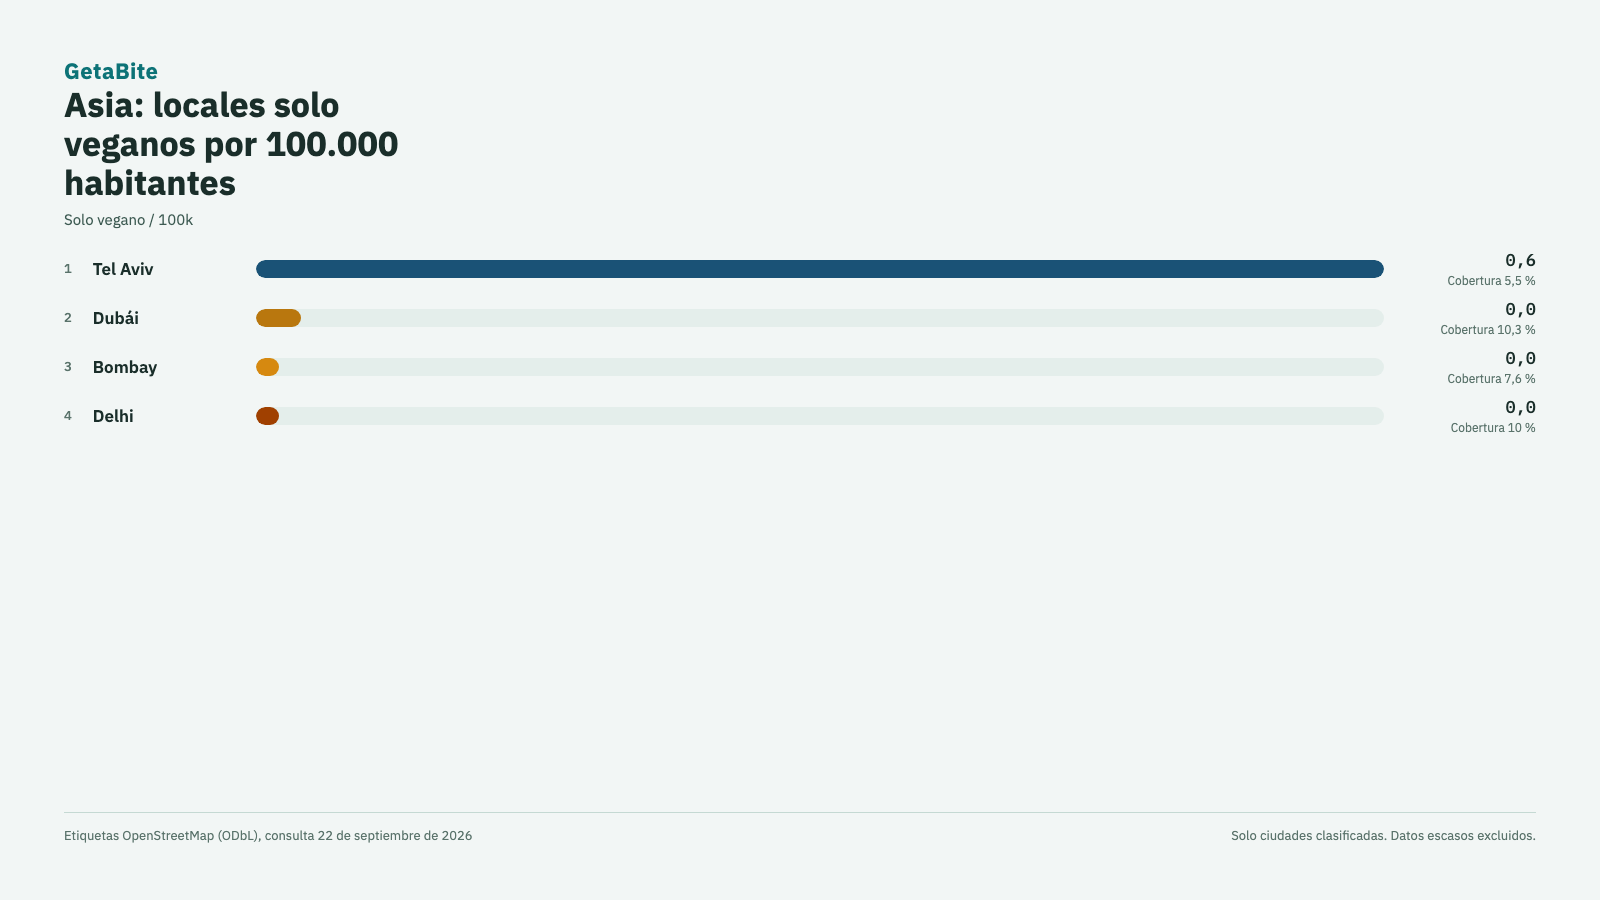
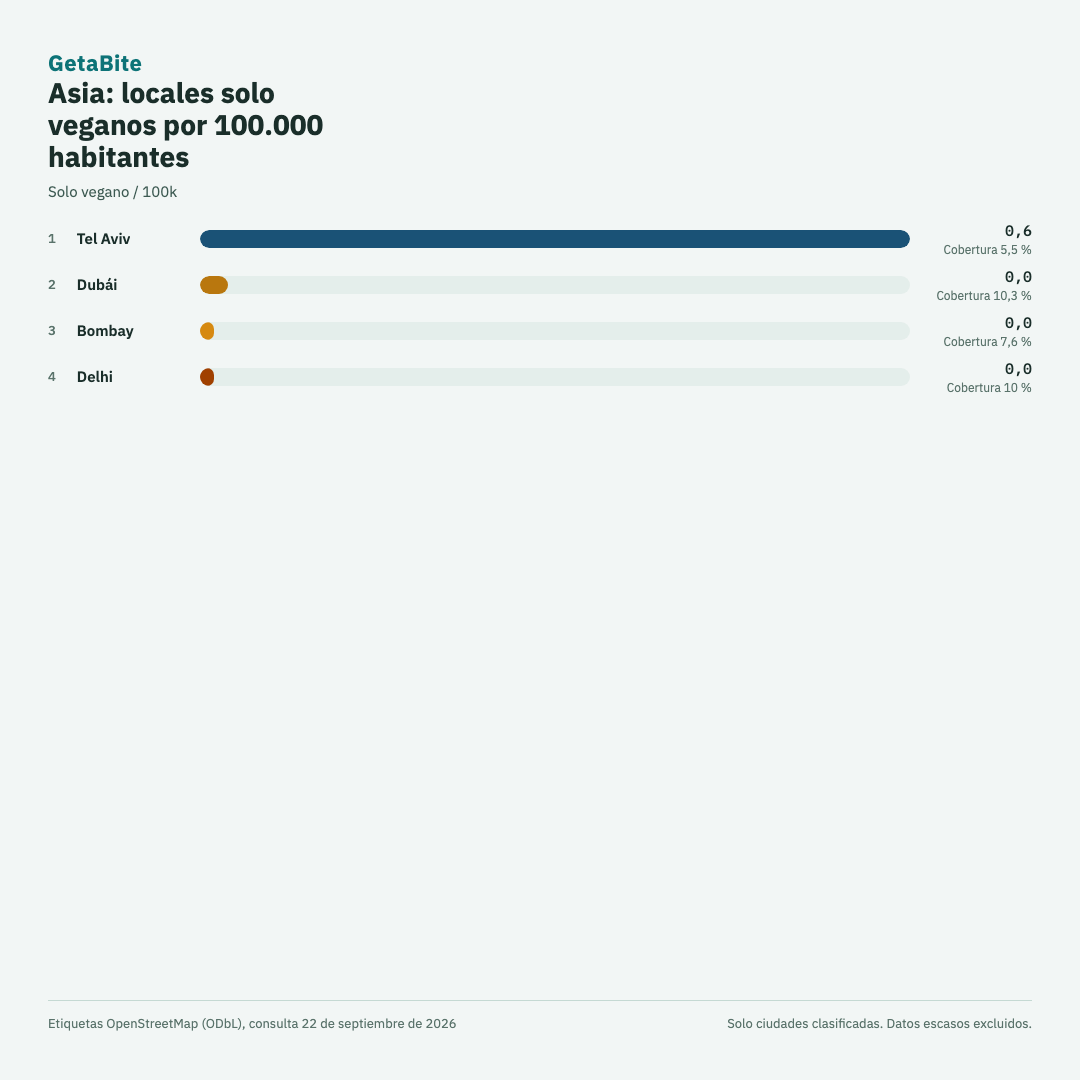
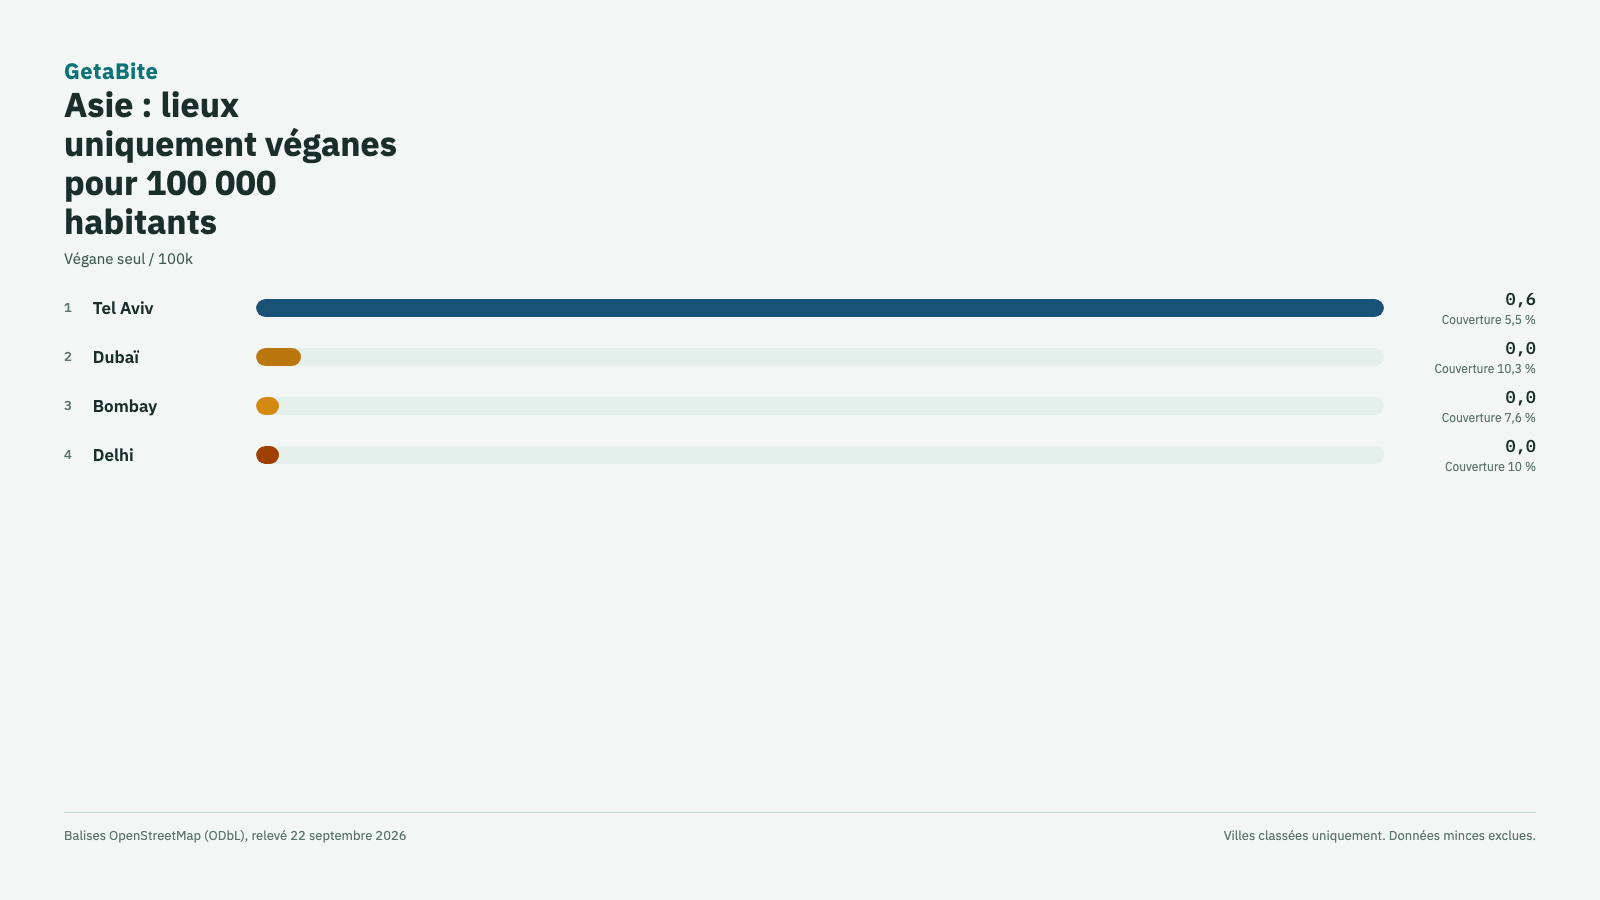
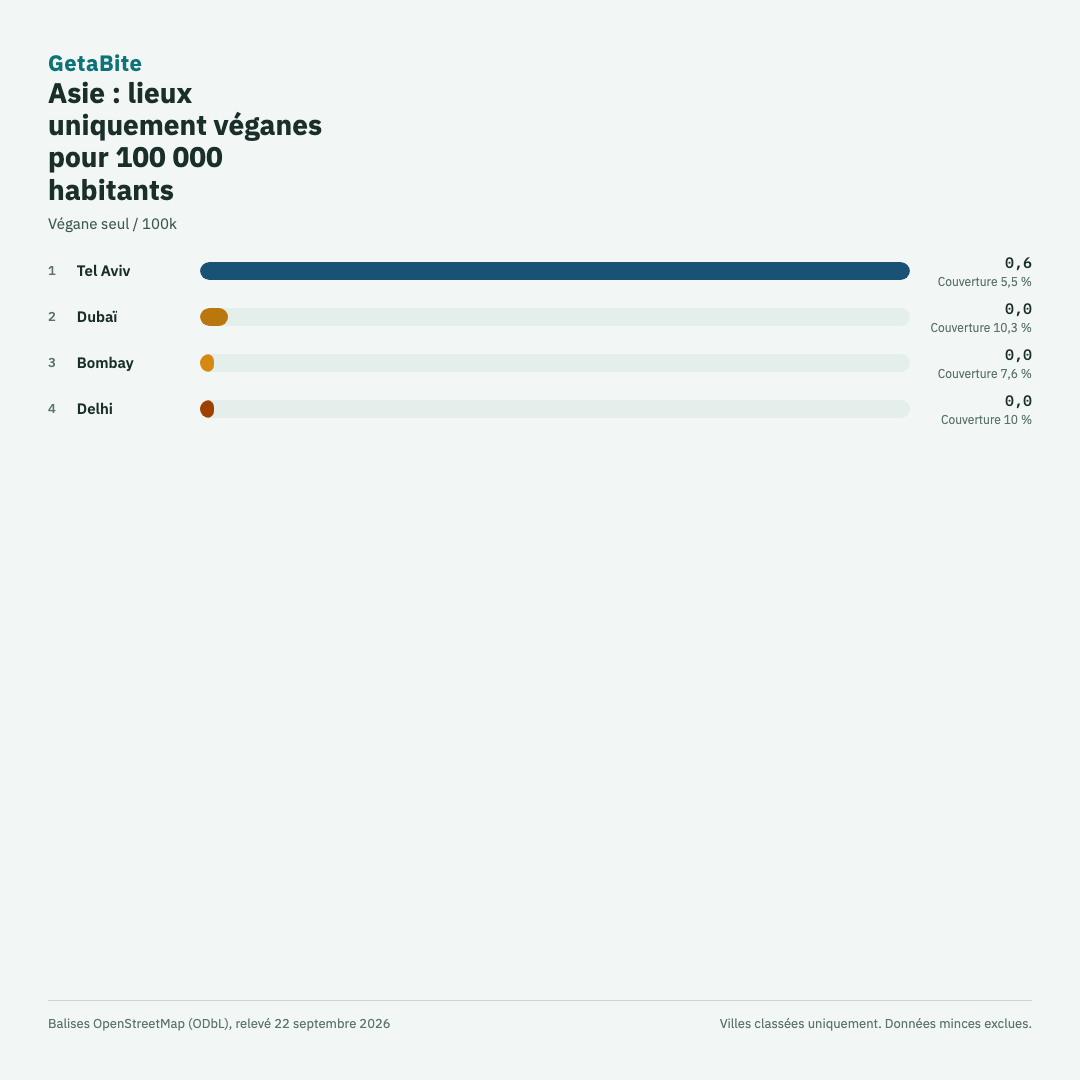
Asia ranking
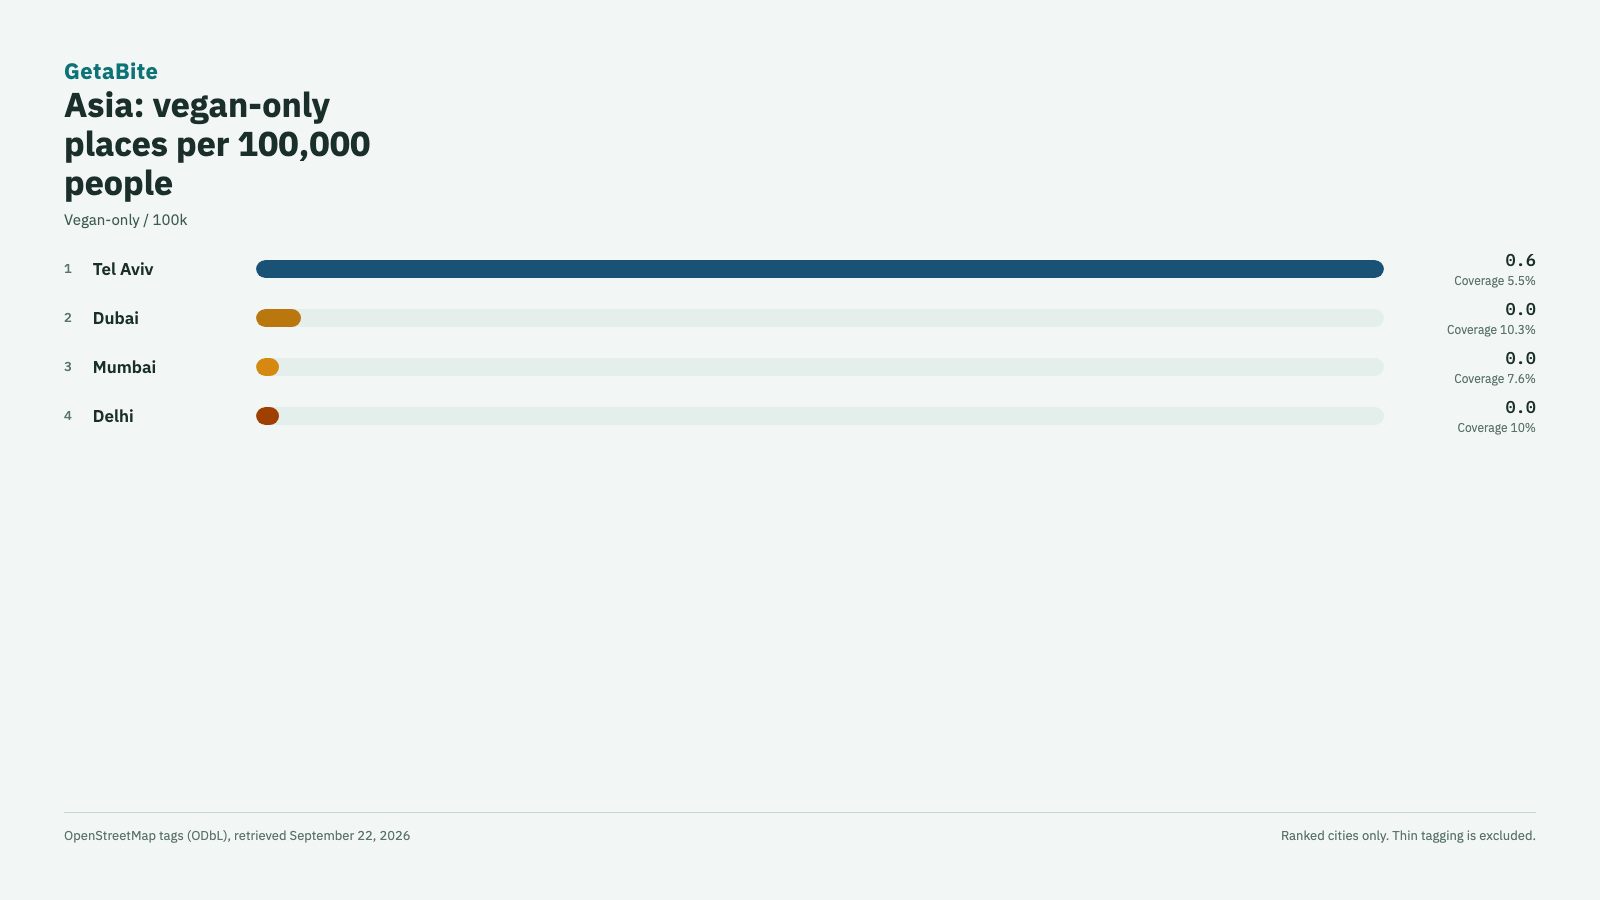
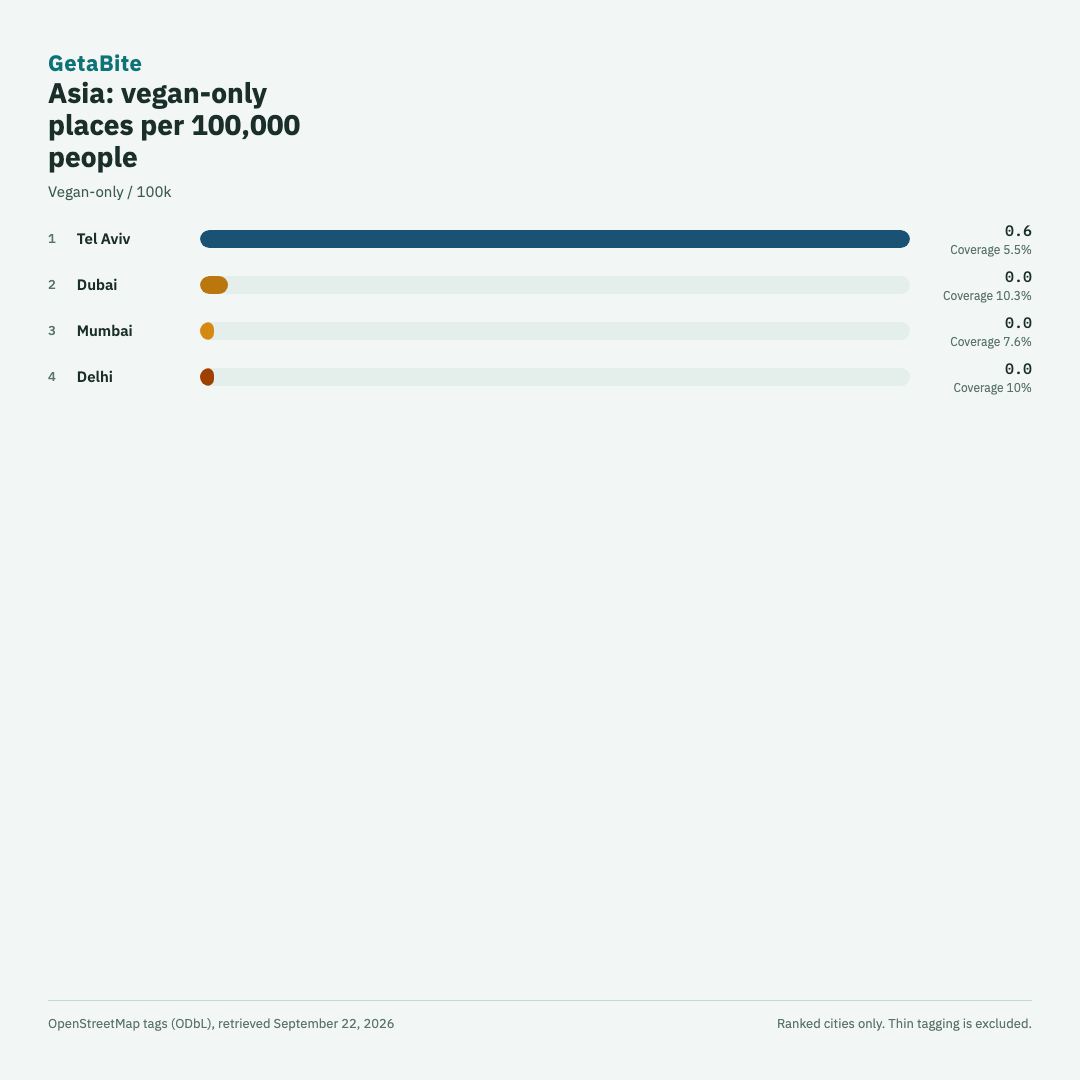
de Landscape · de Square · es Landscape · es Square · fr Landscape · fr Square
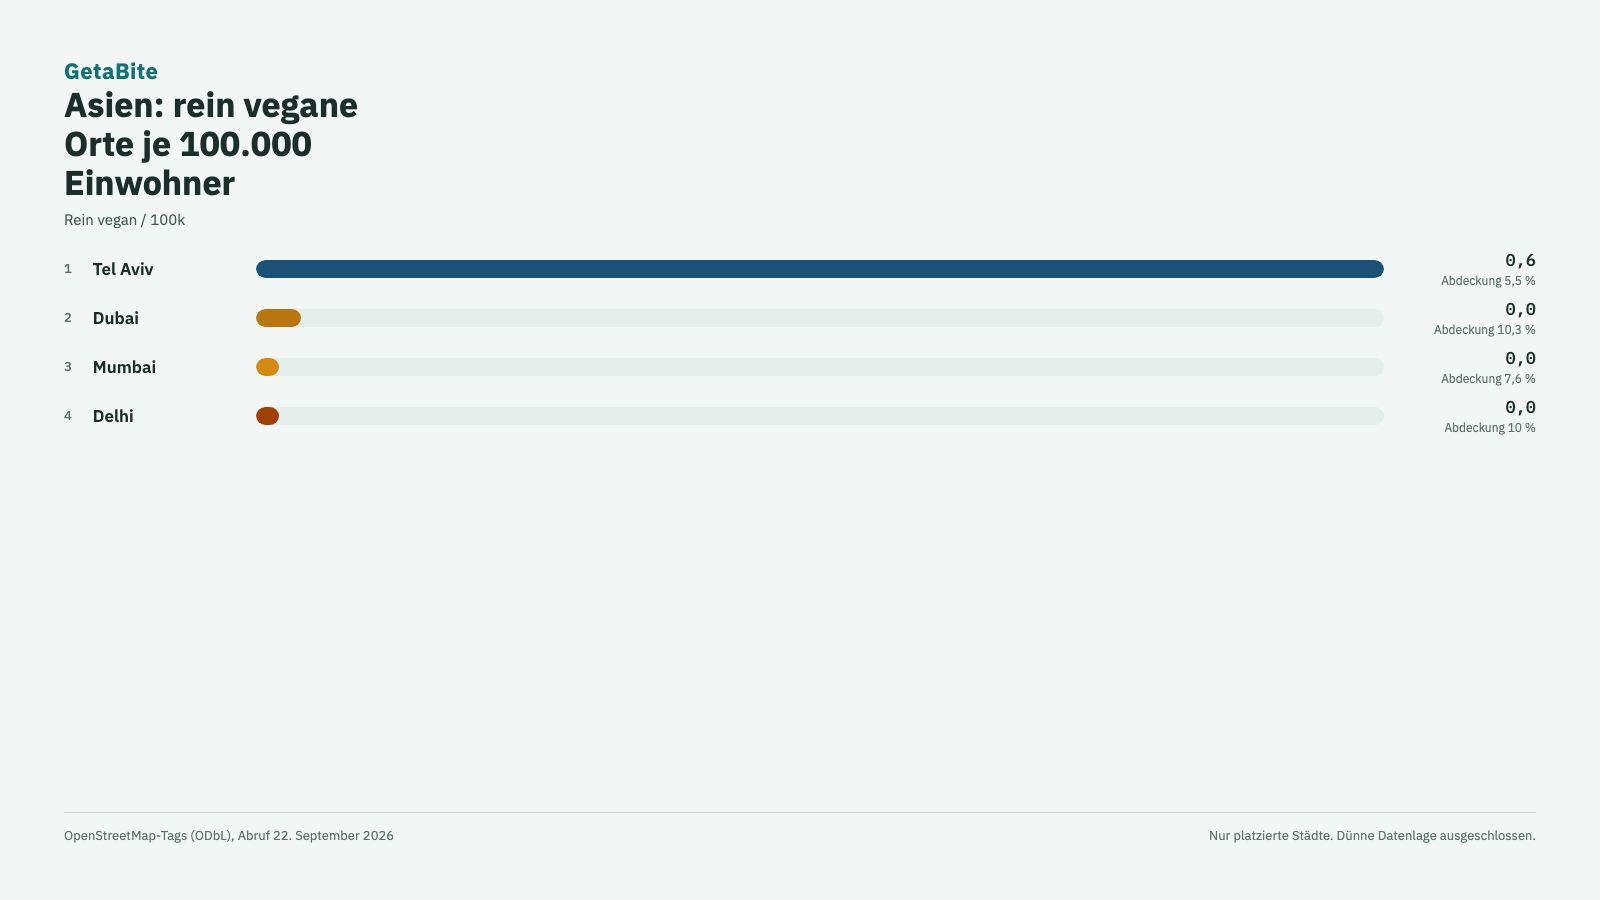
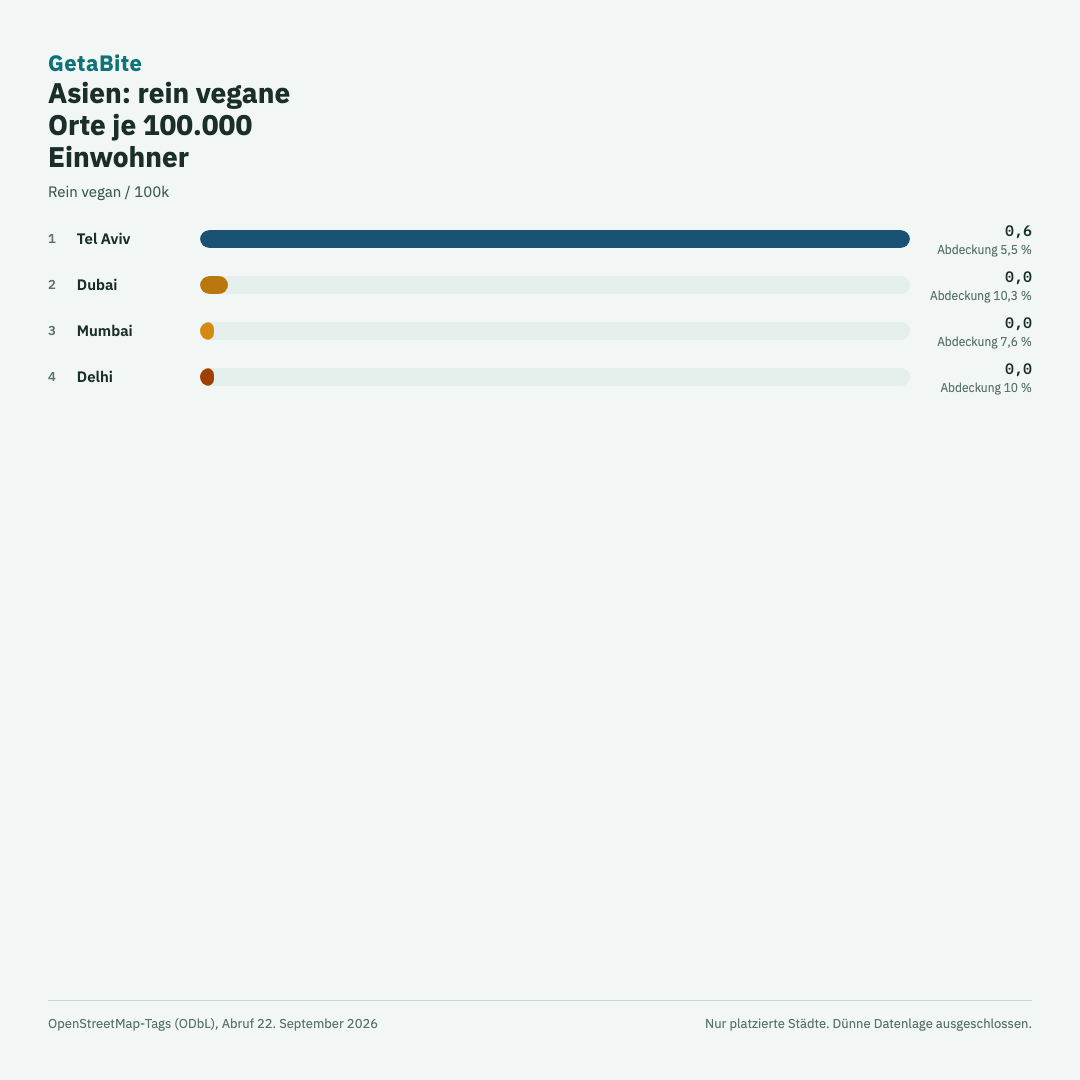
Africa ranking
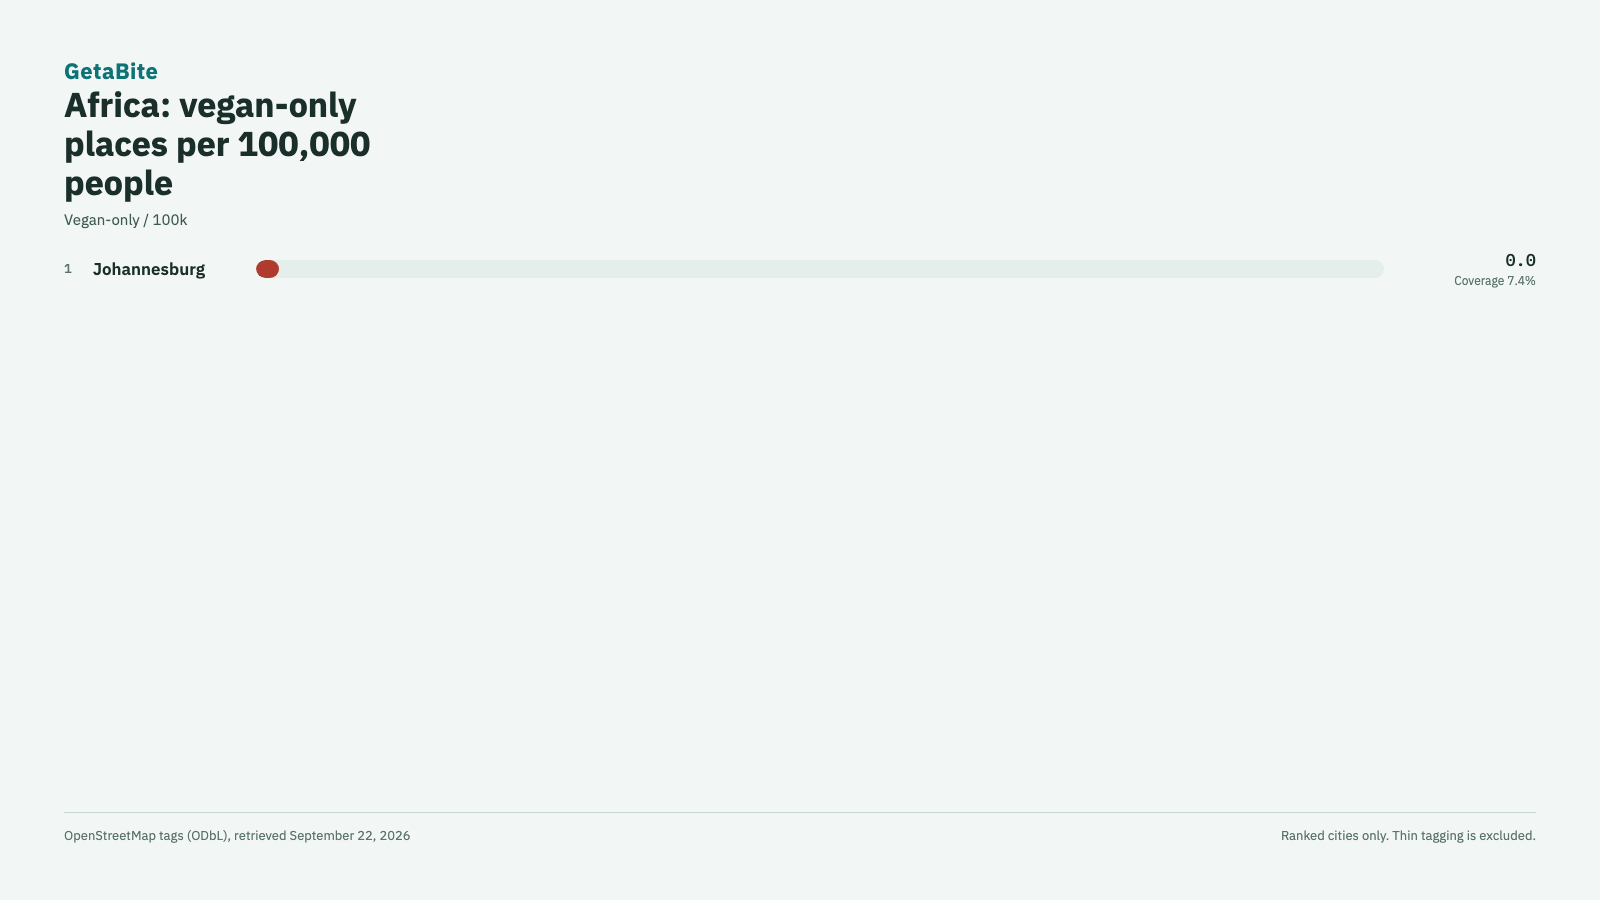
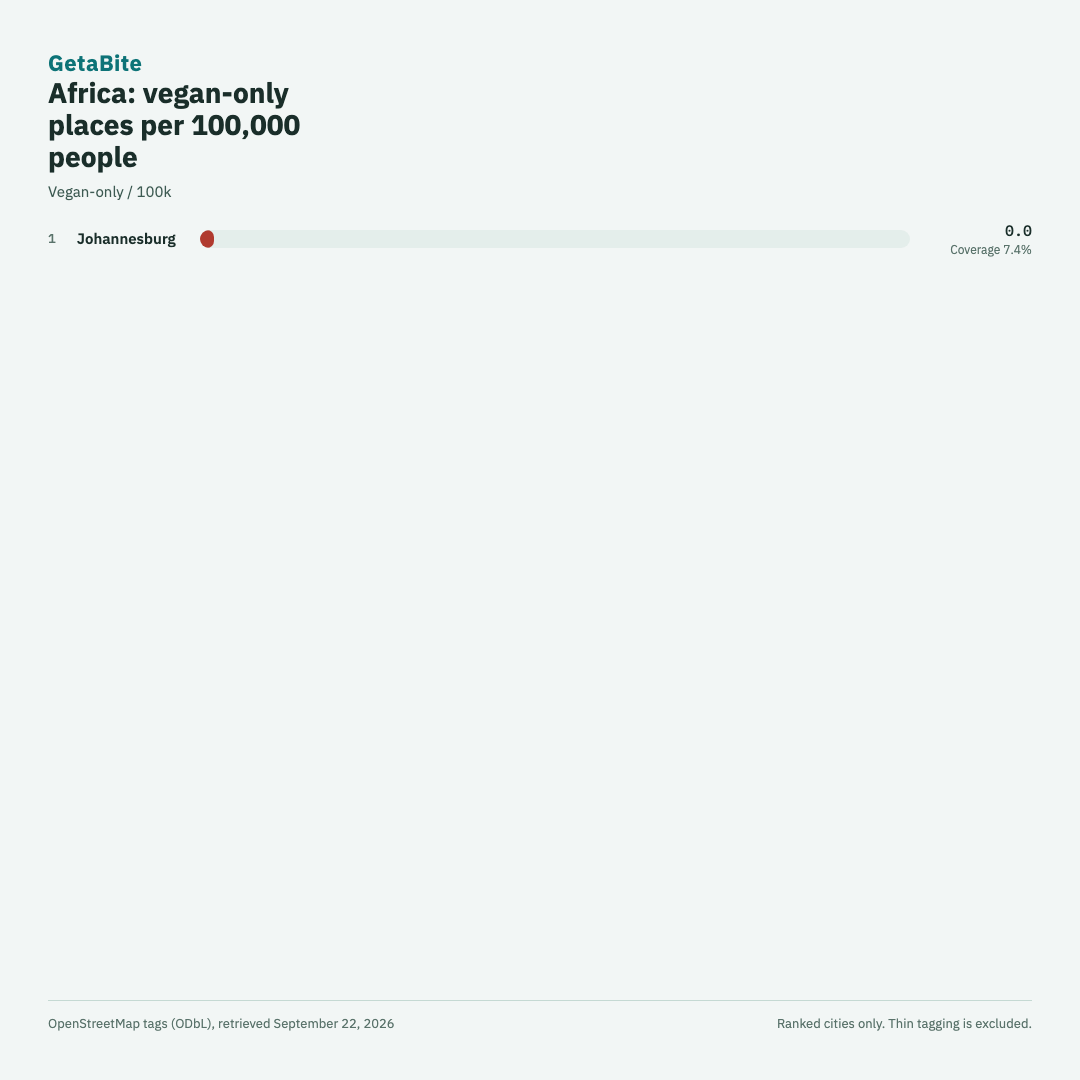
de Landscape · de Square · es Landscape · es Square · fr Landscape · fr Square
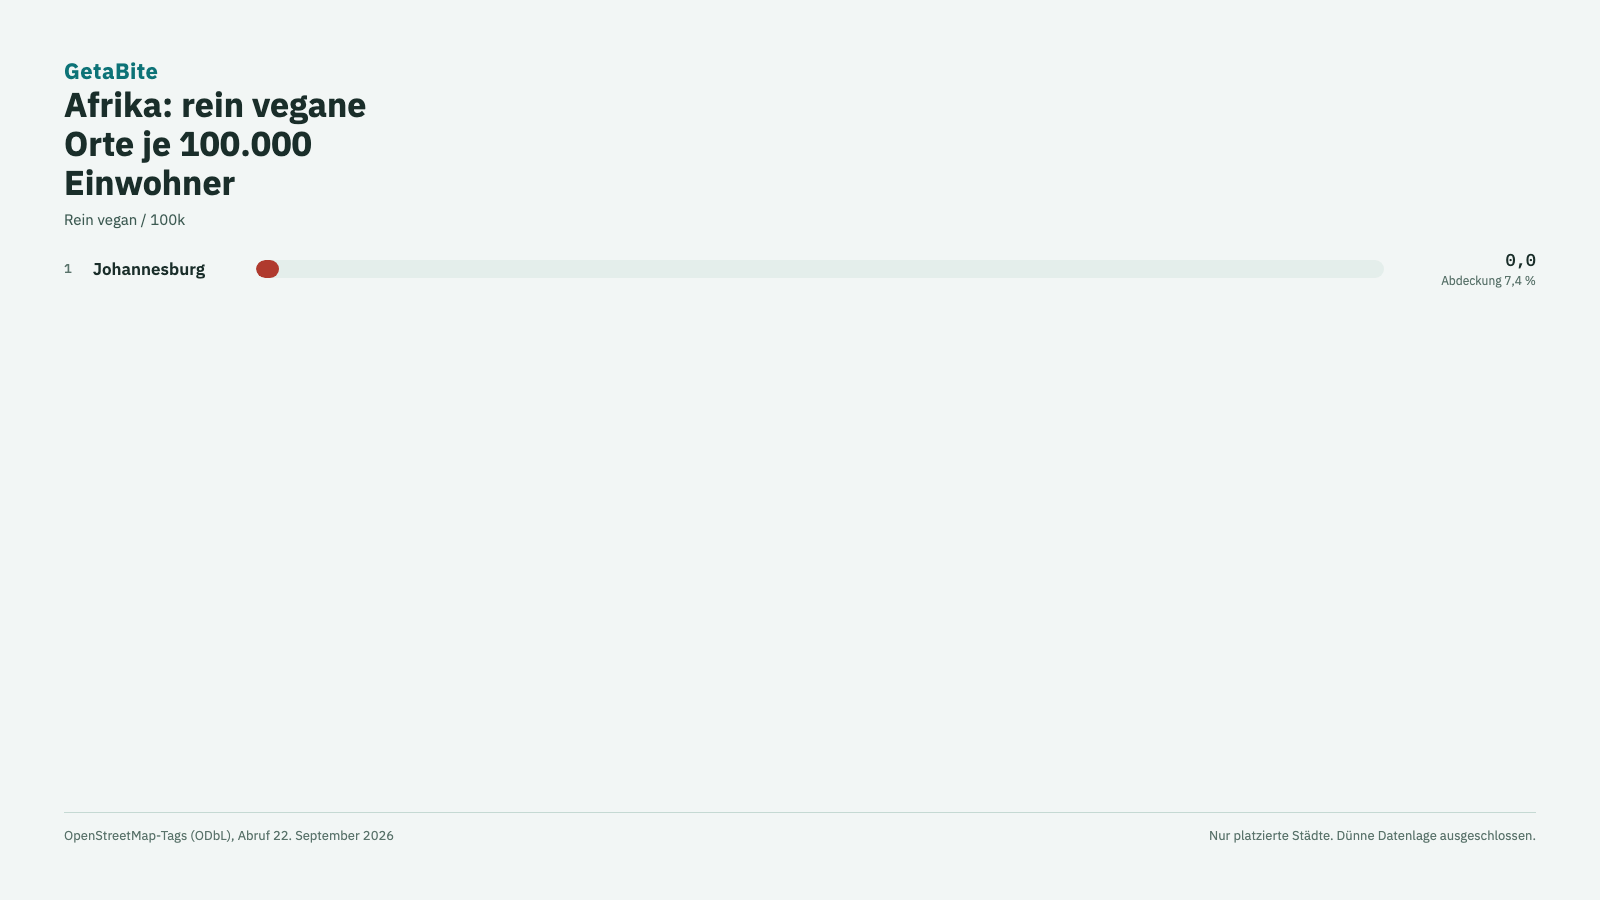
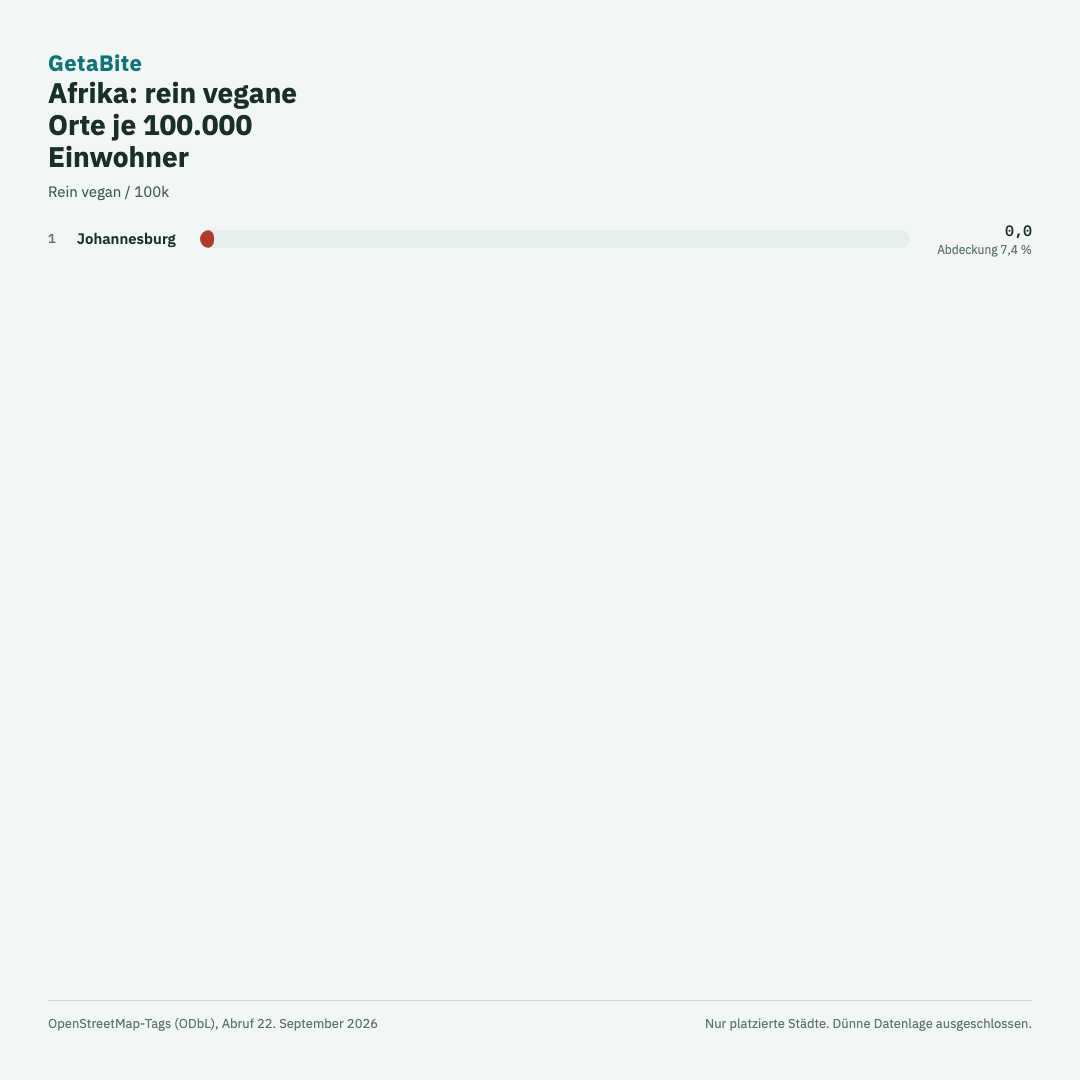
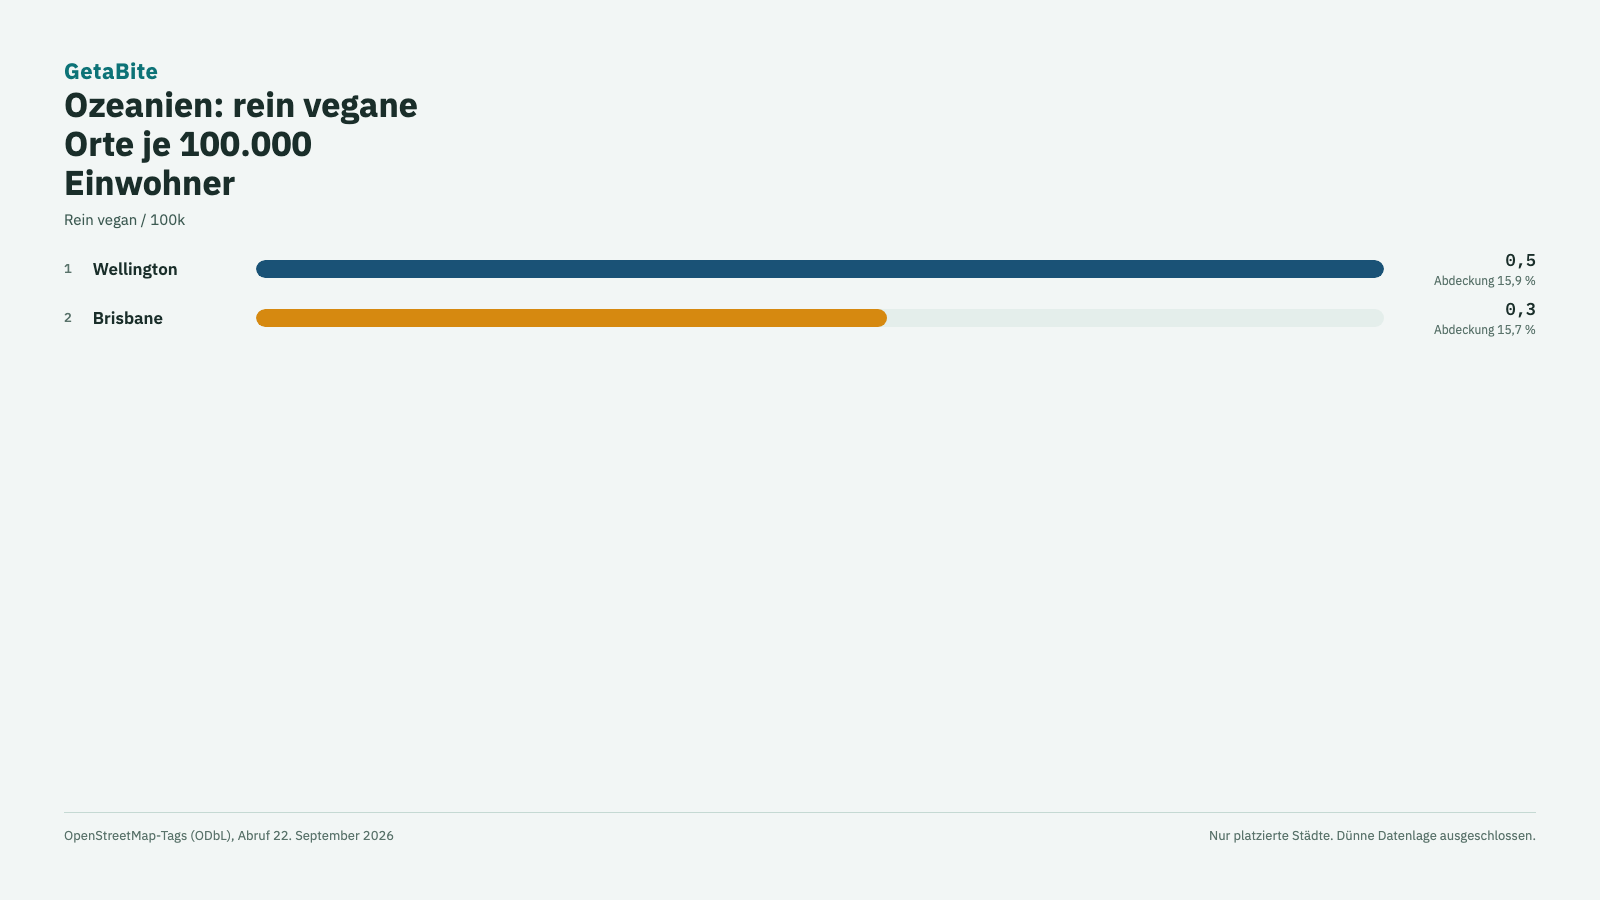
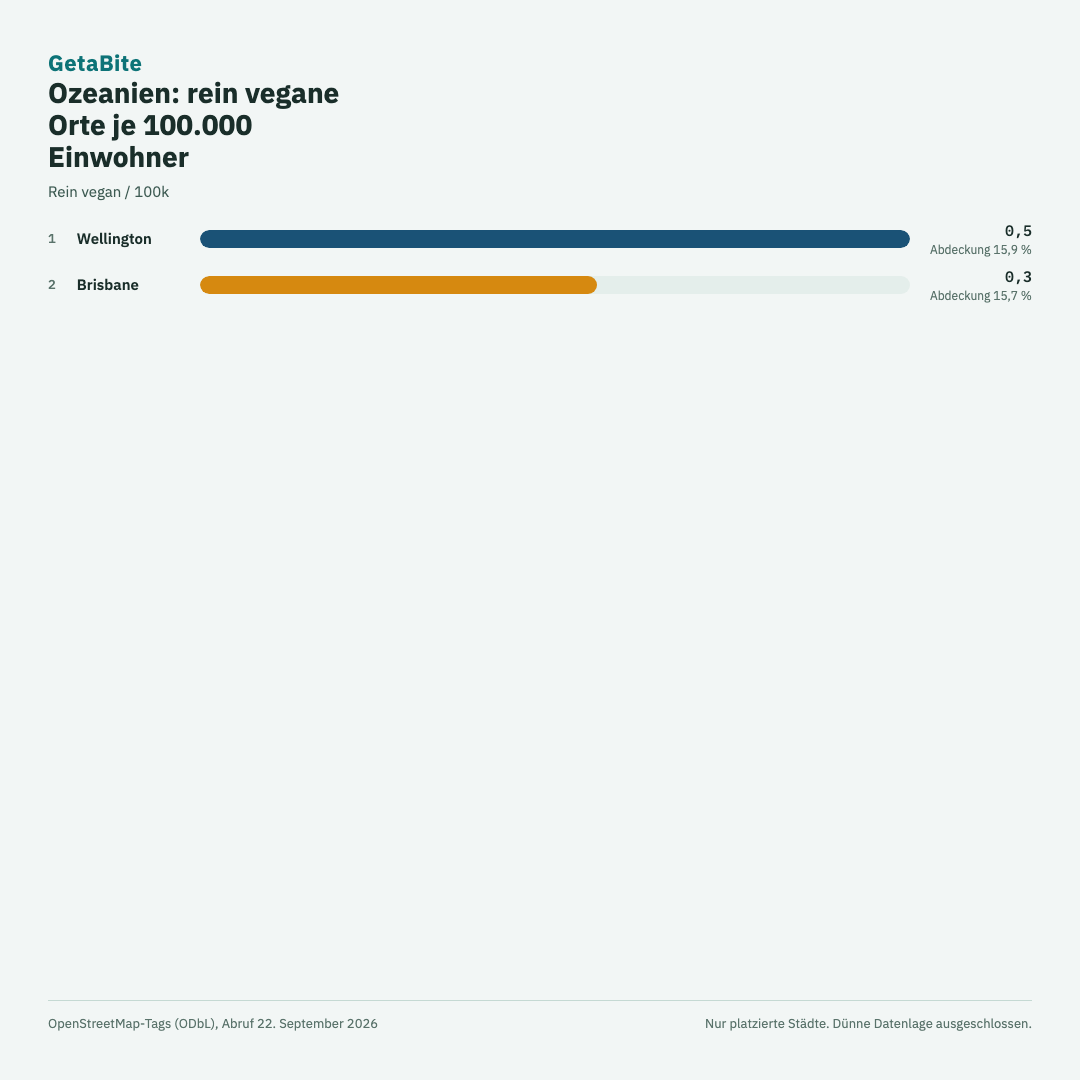
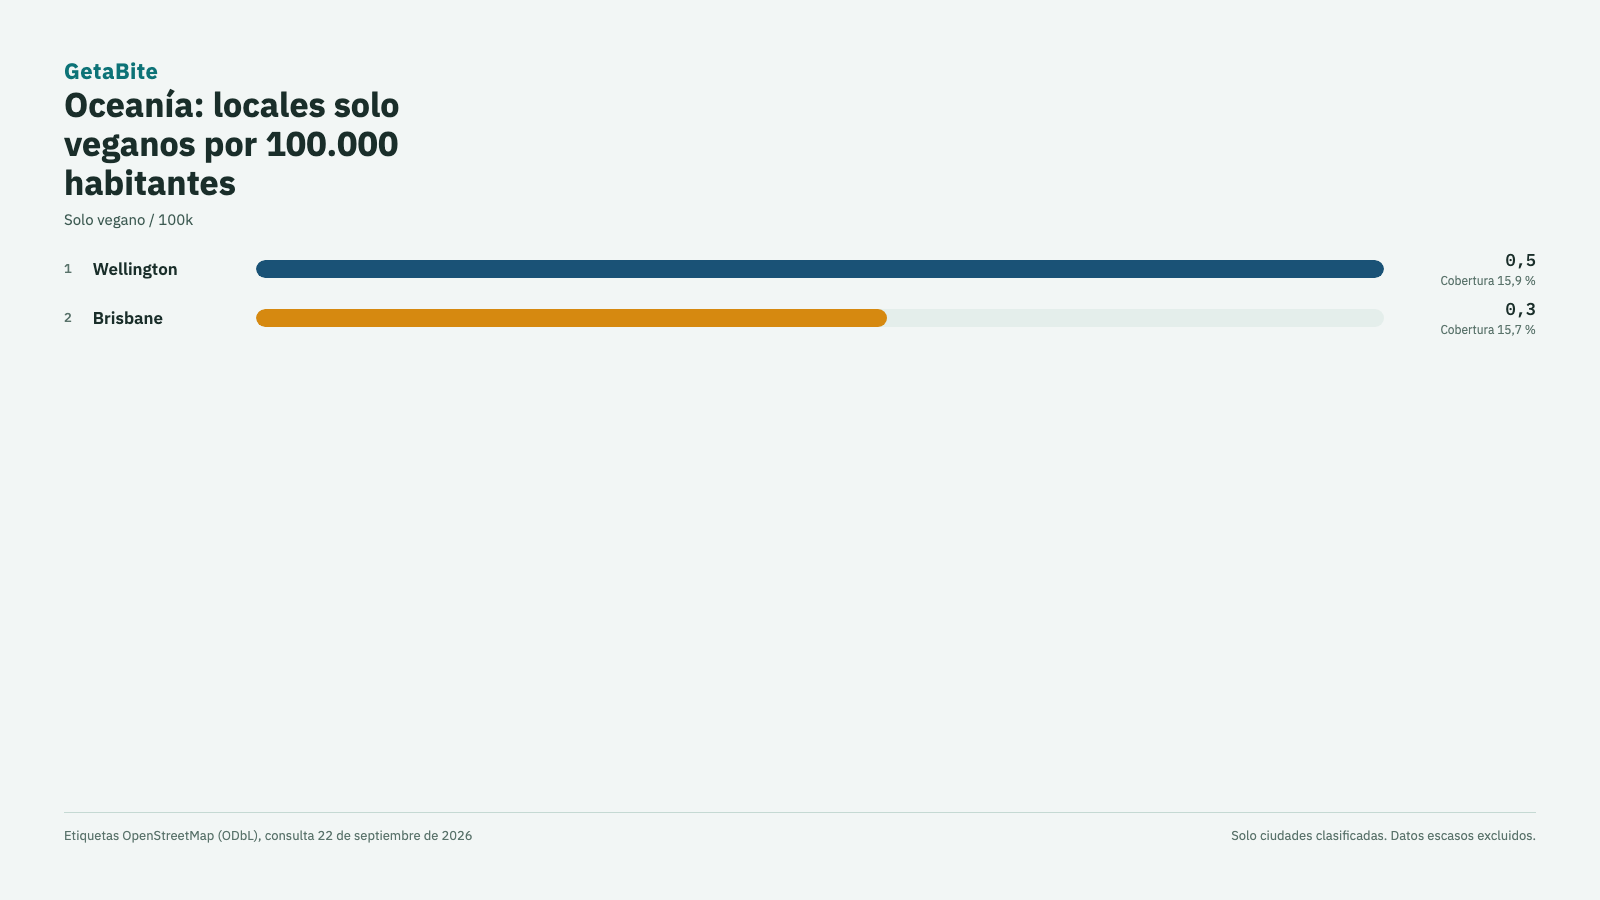
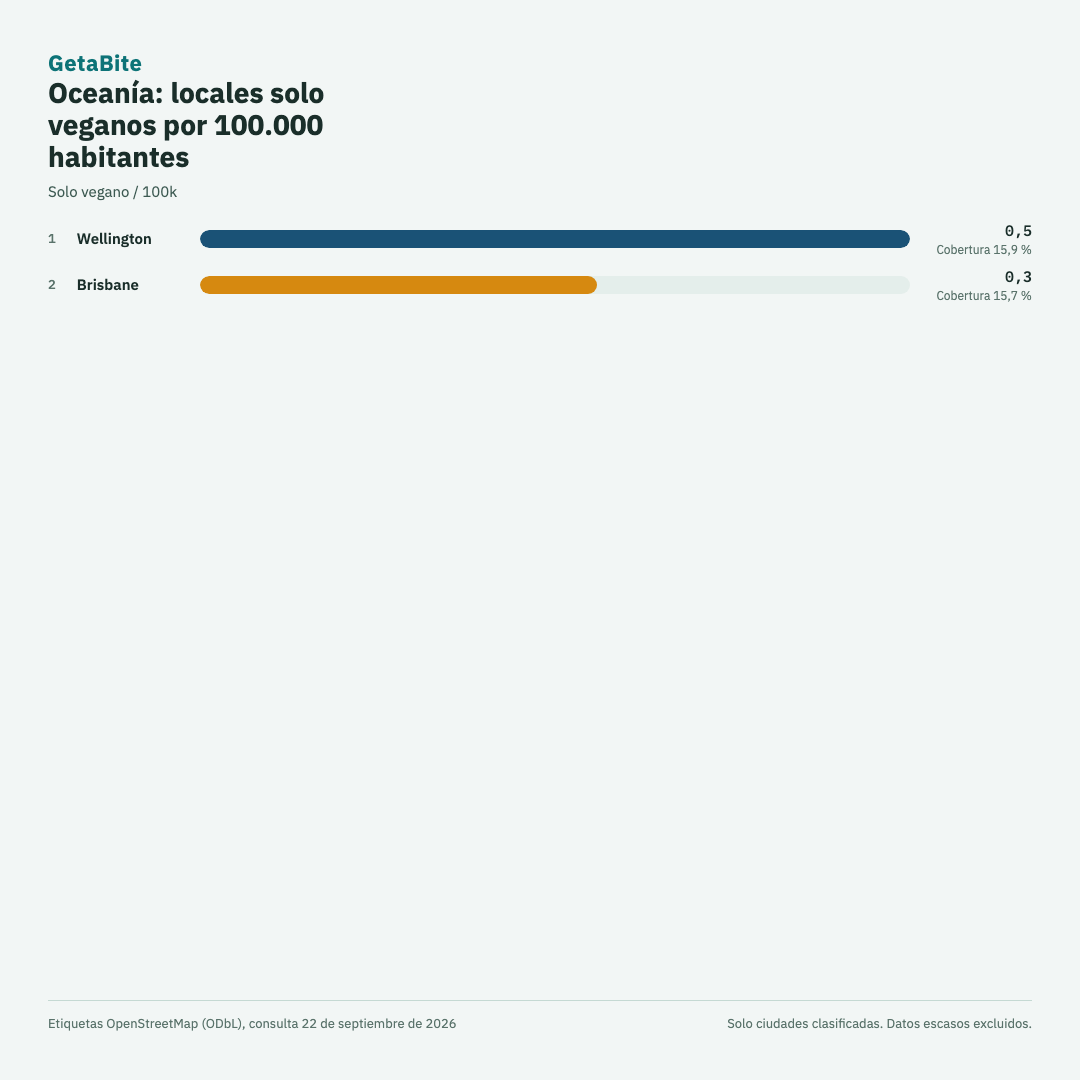
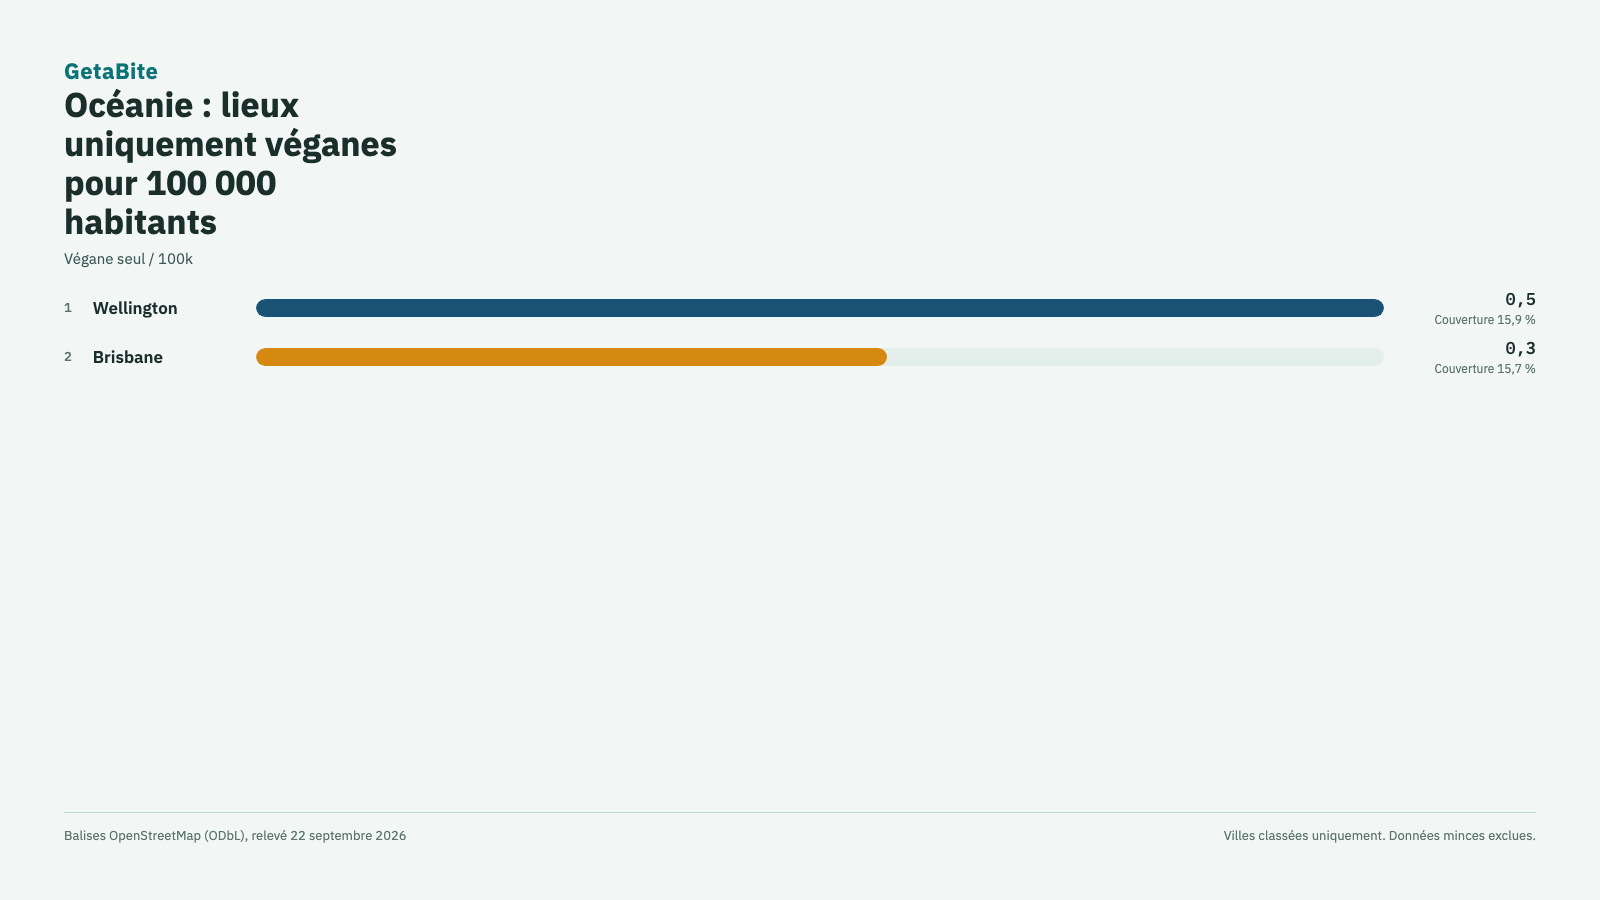
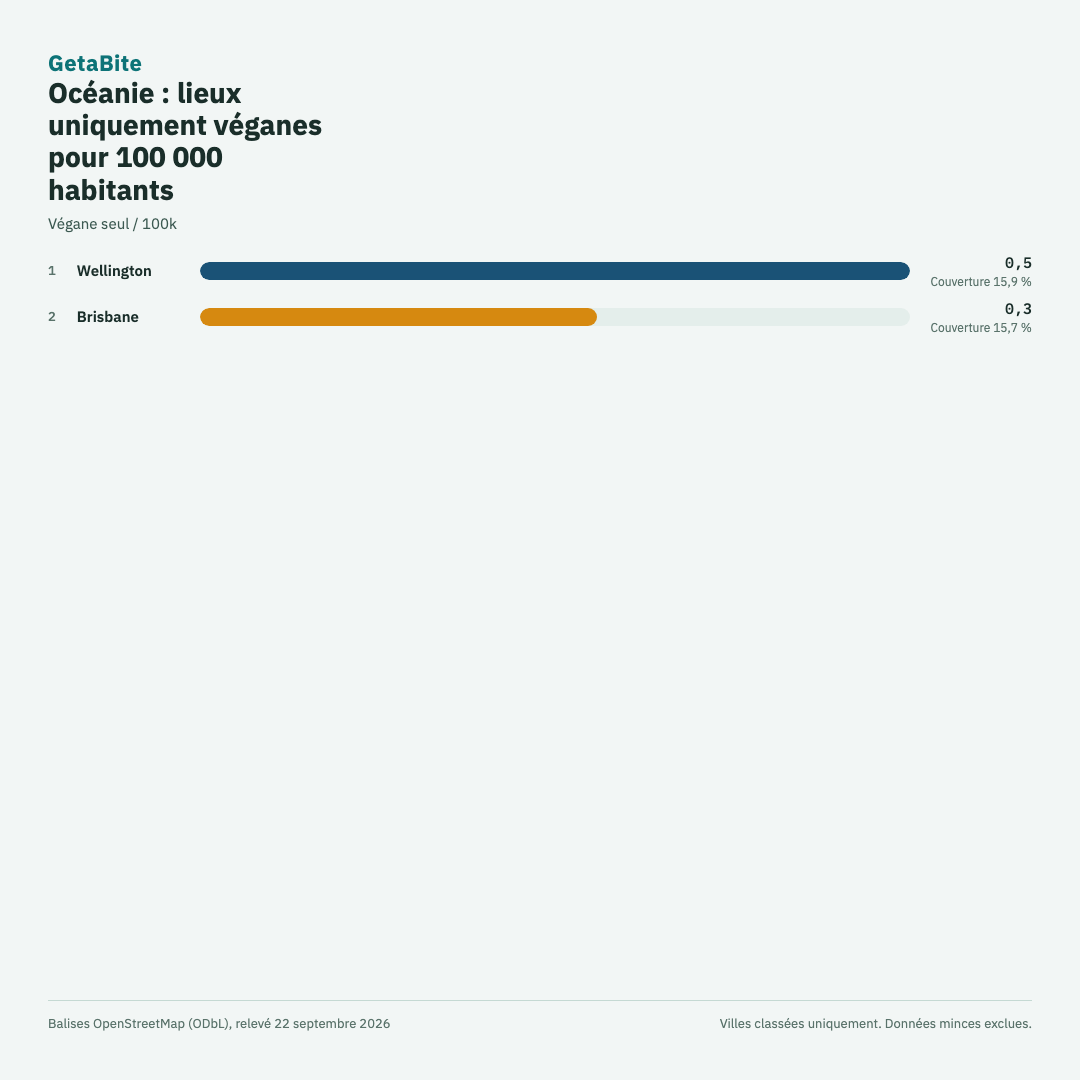
Oceania ranking
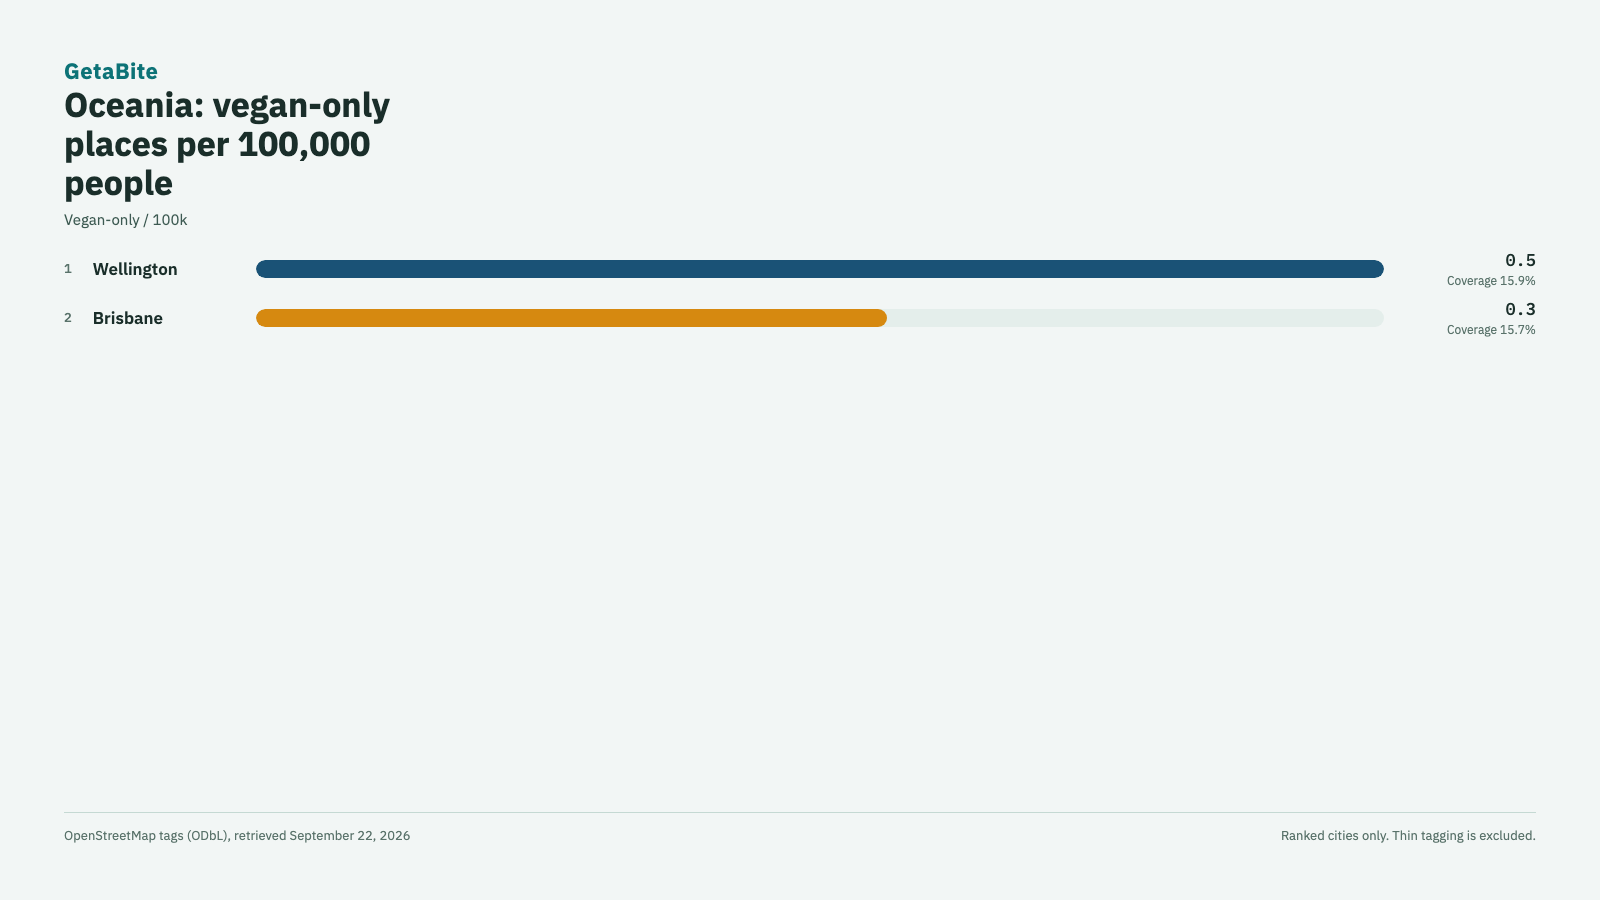
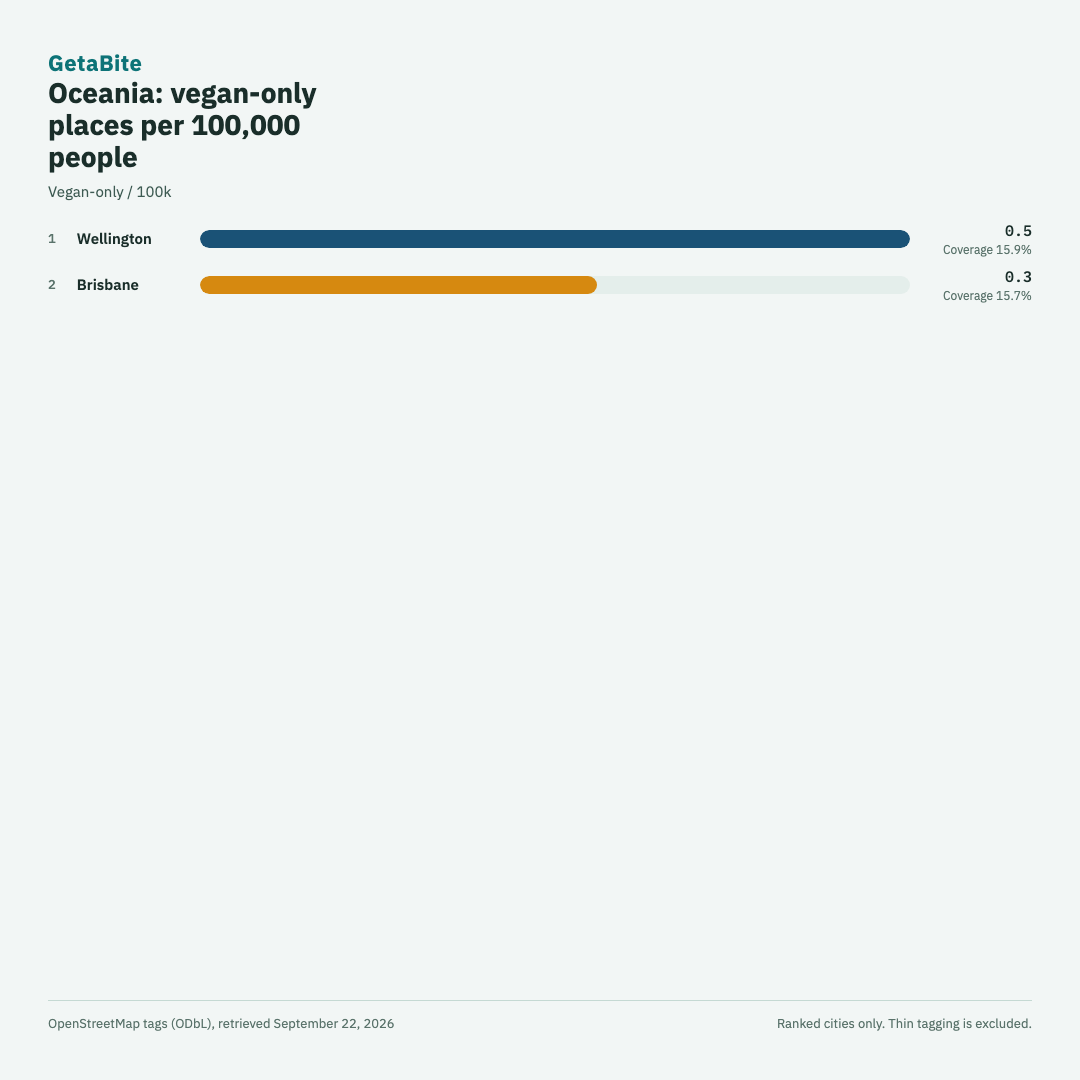
de Landscape · de Square · es Landscape · es Square · fr Landscape · fr Square
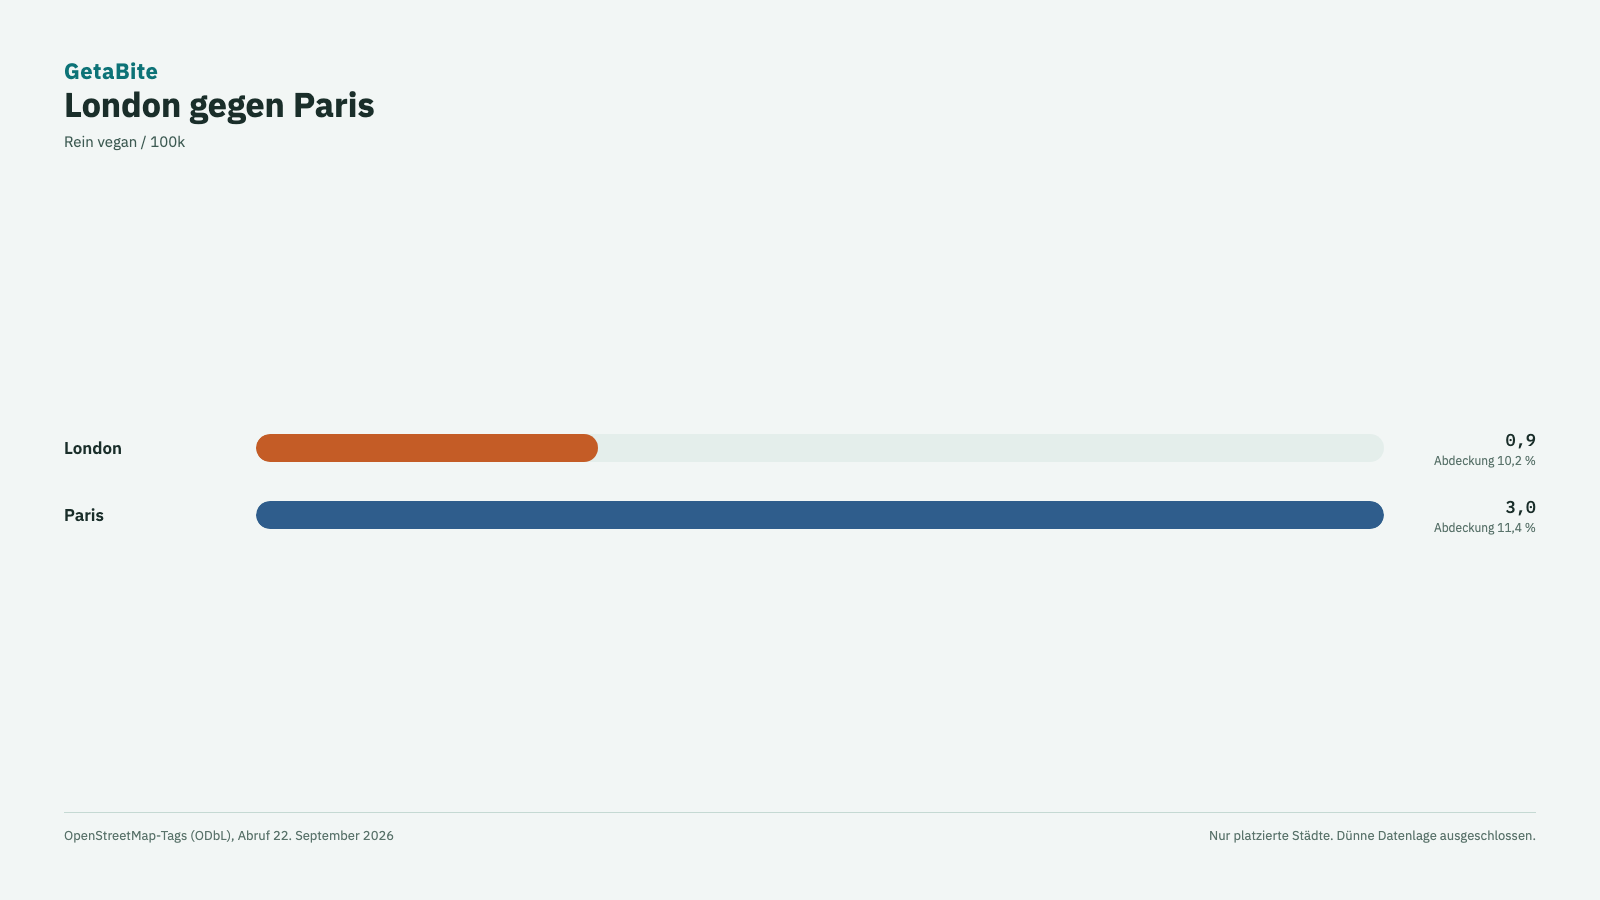
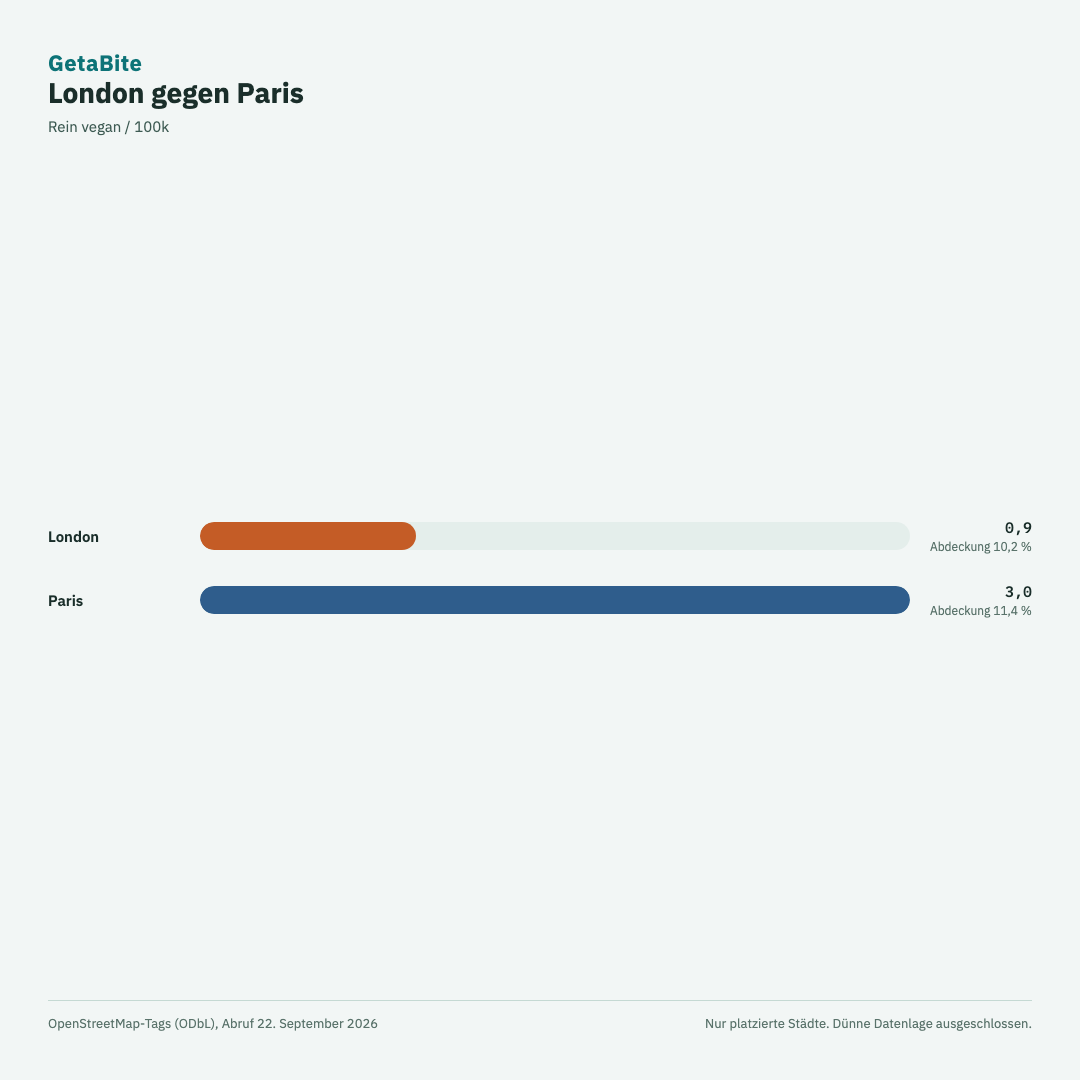
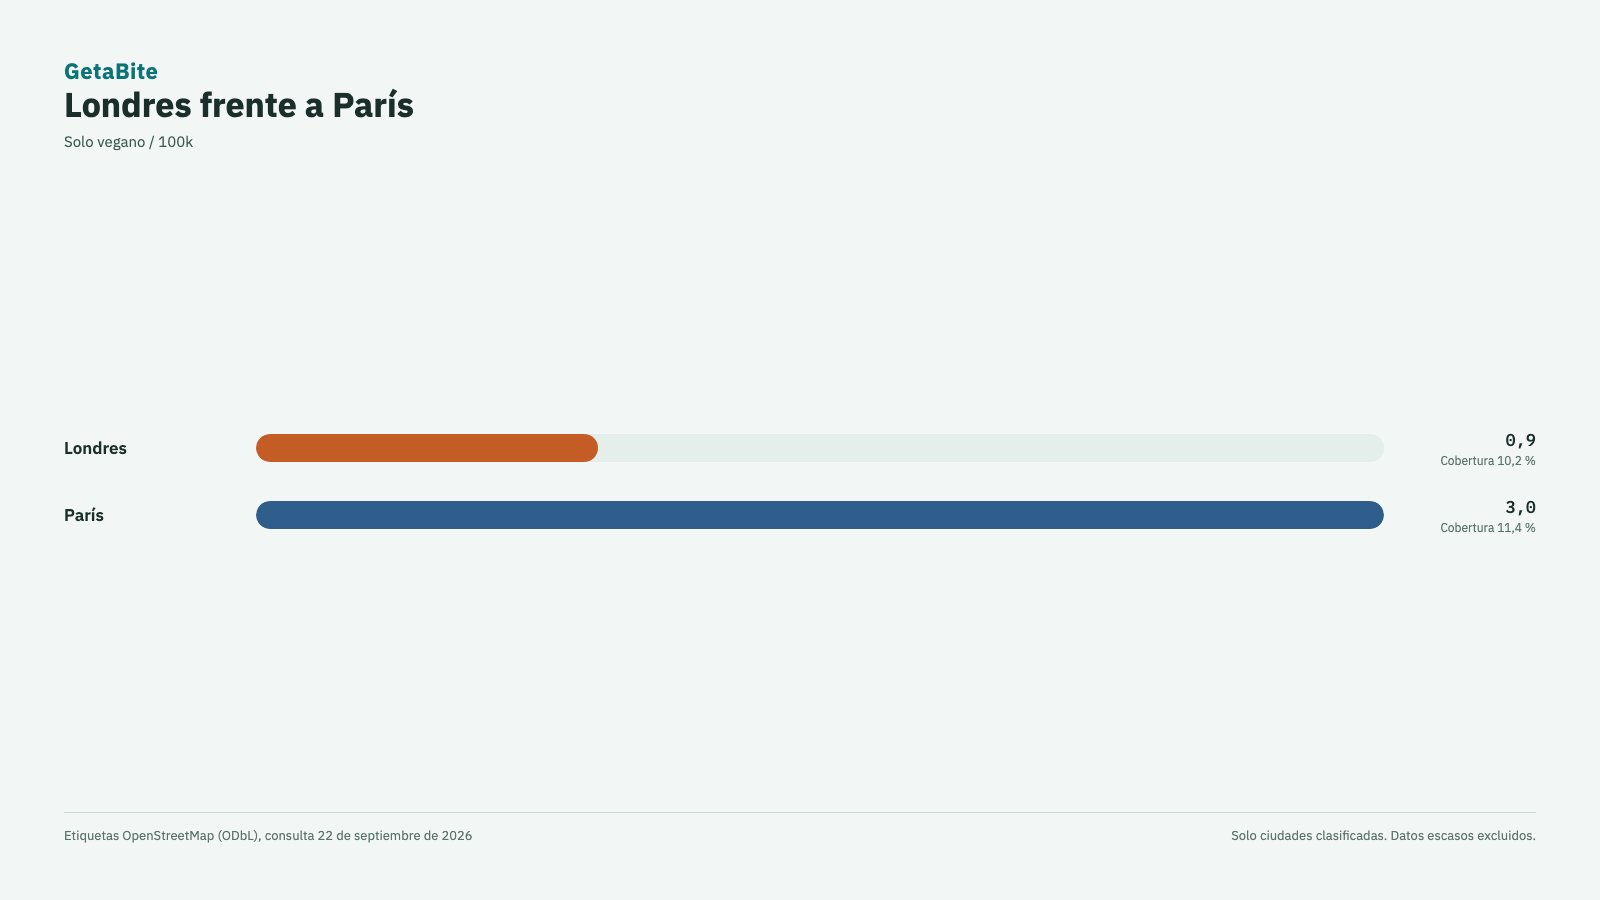
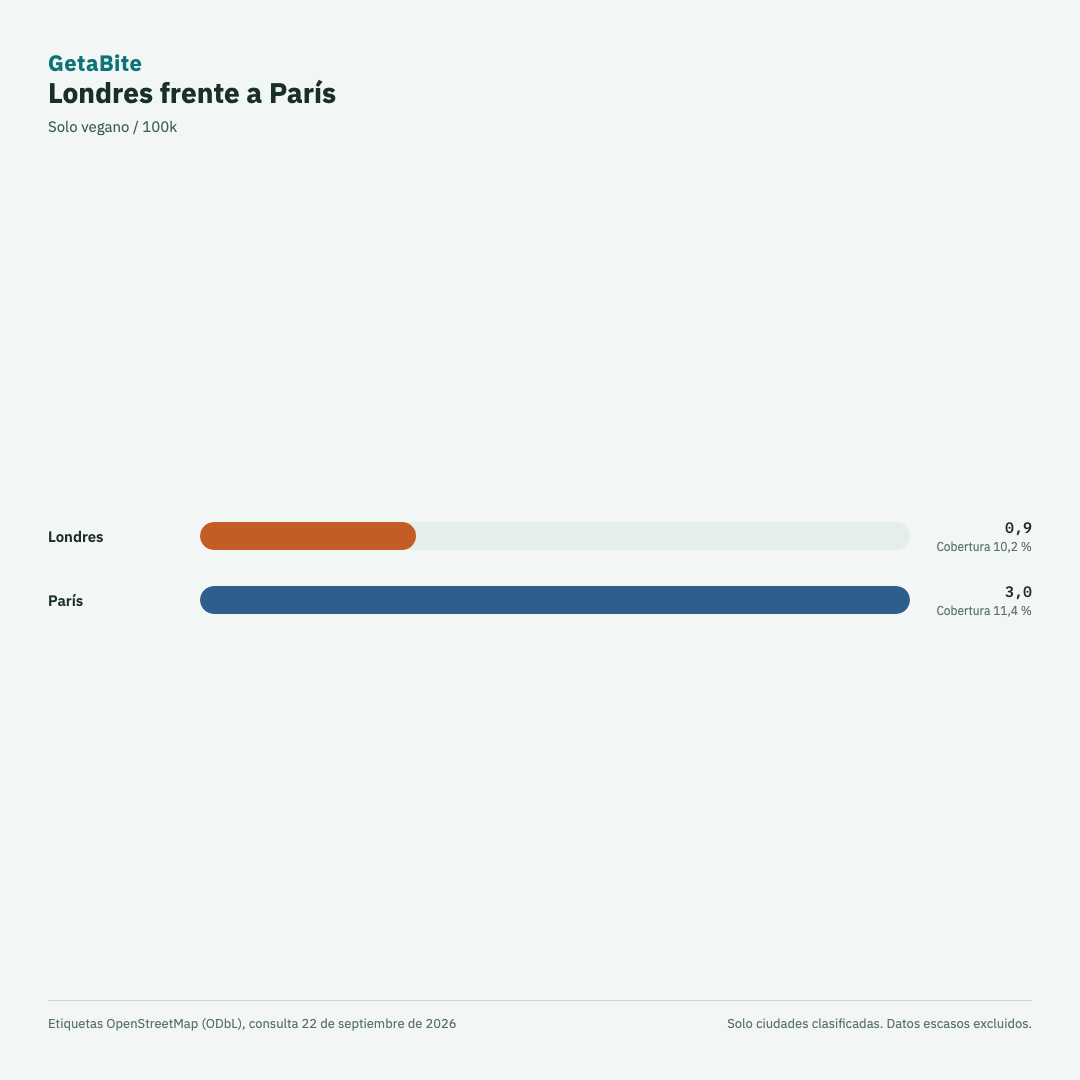
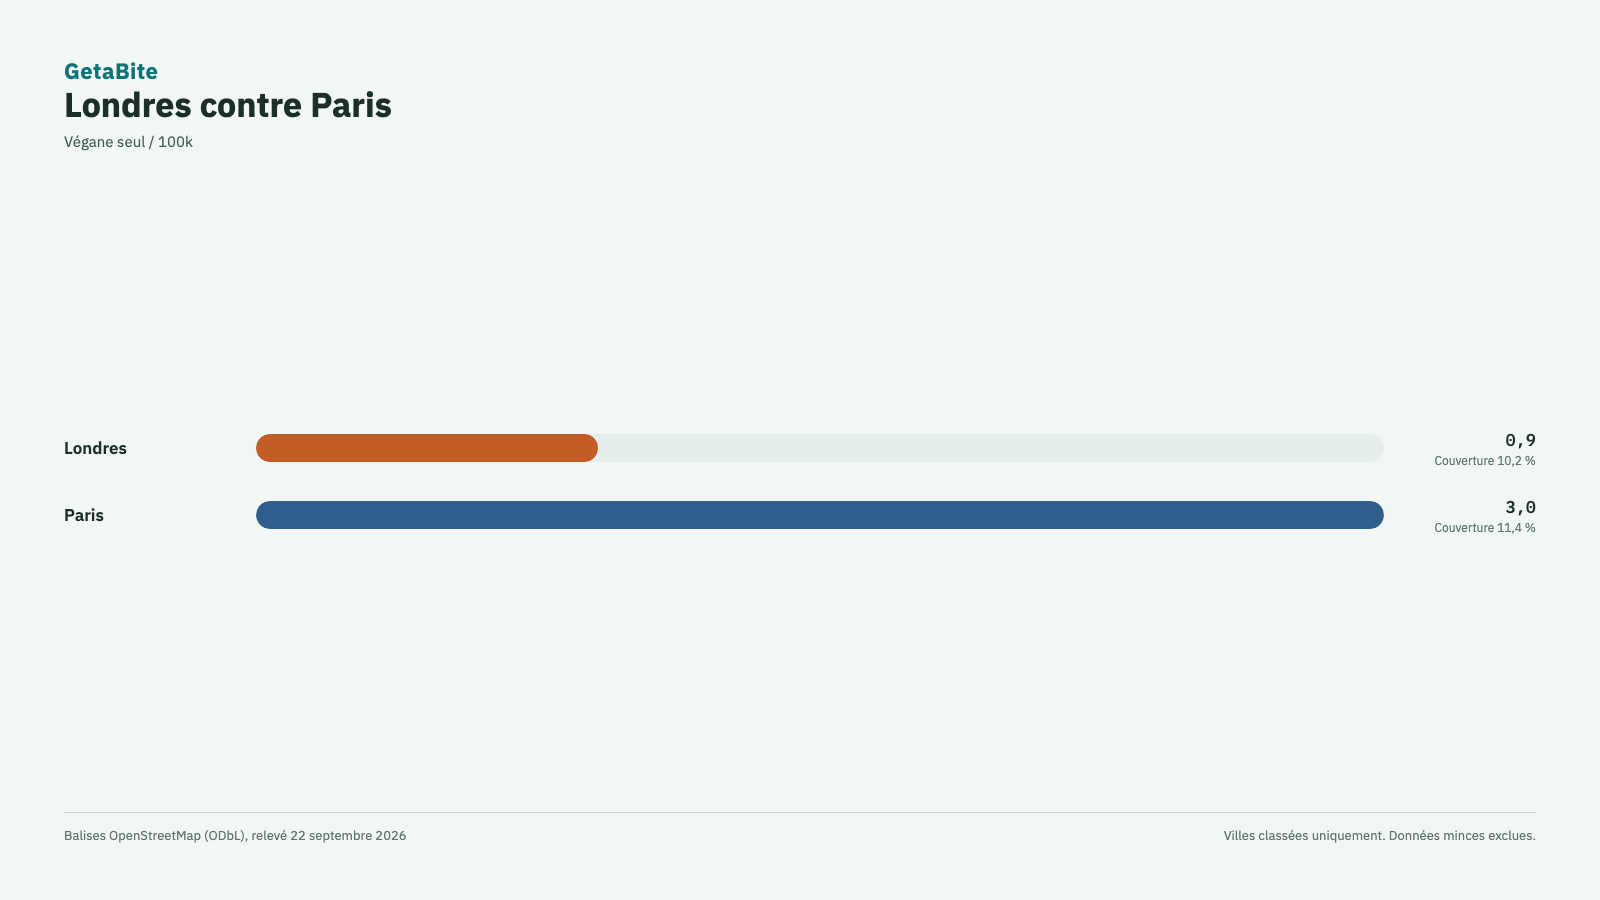
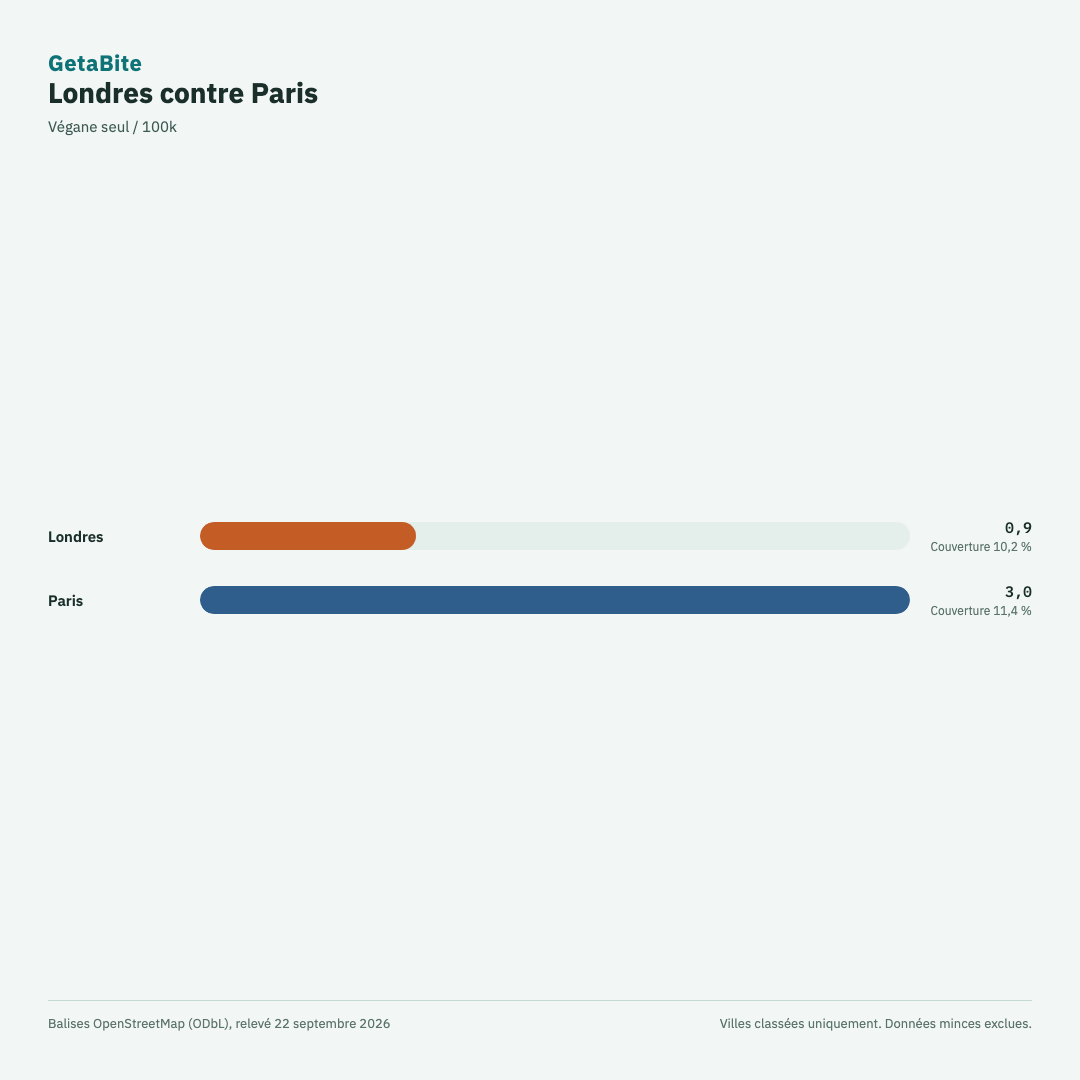
Duel: London vs Paris
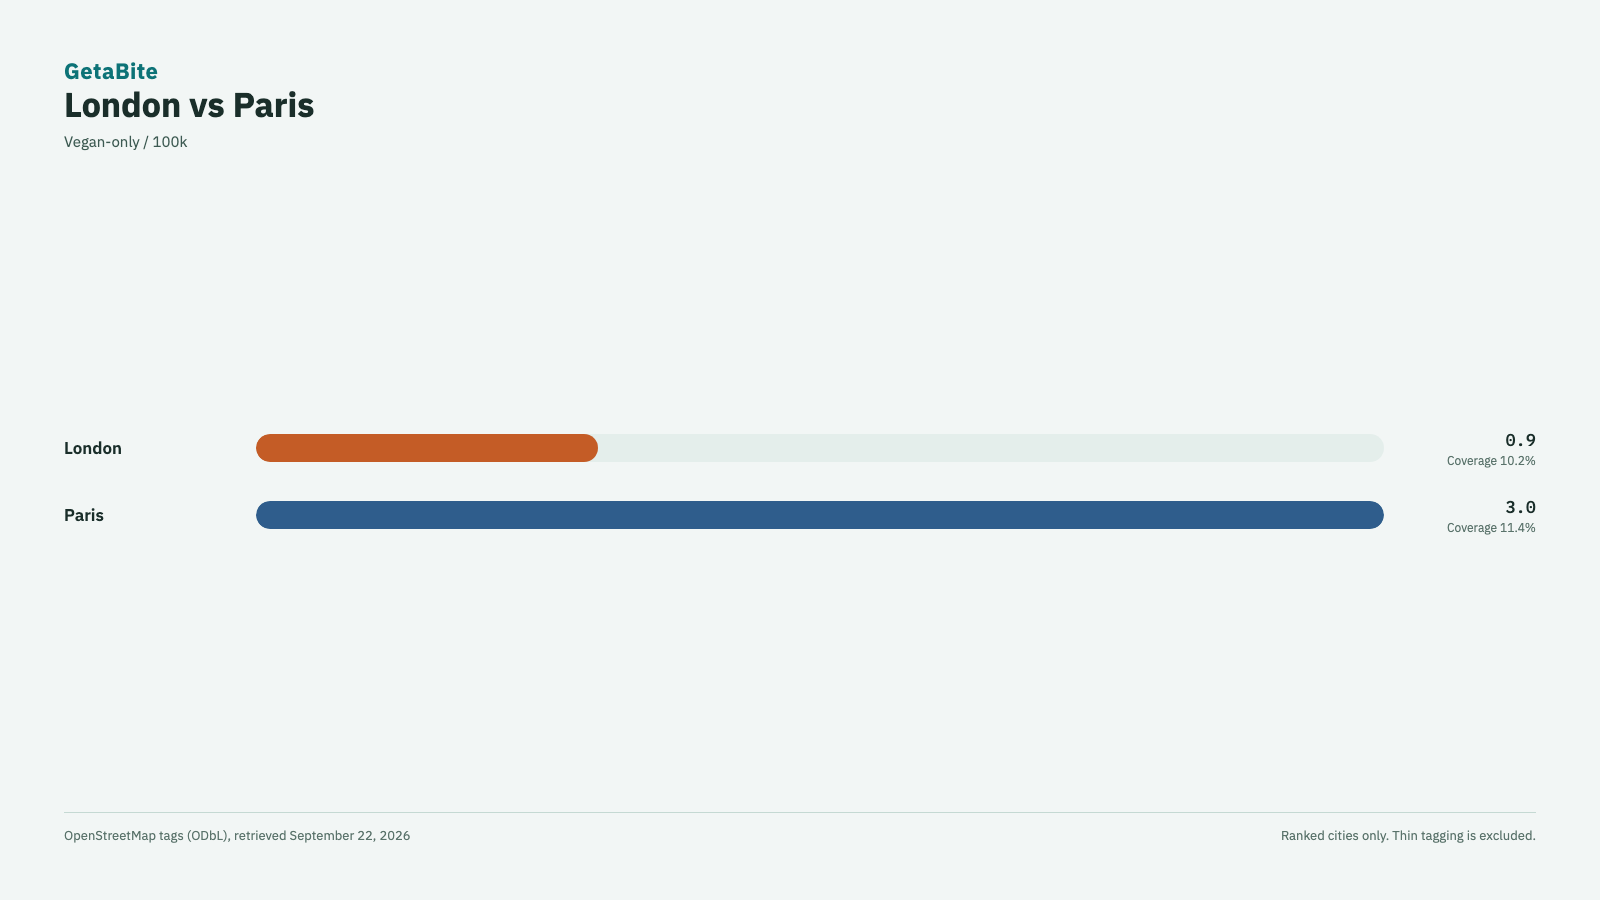
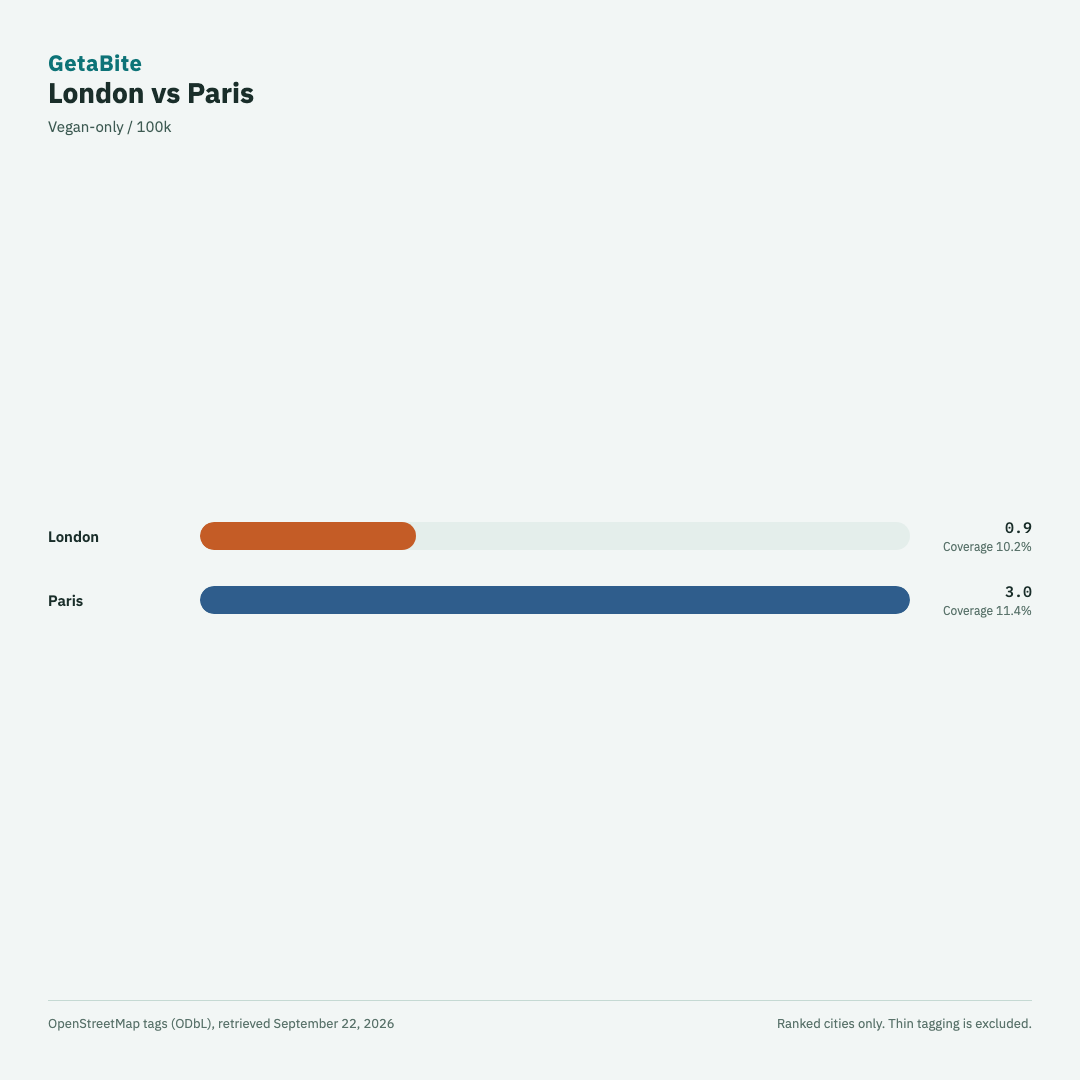
de Landscape · de Square · es Landscape · es Square · fr Landscape · fr Square
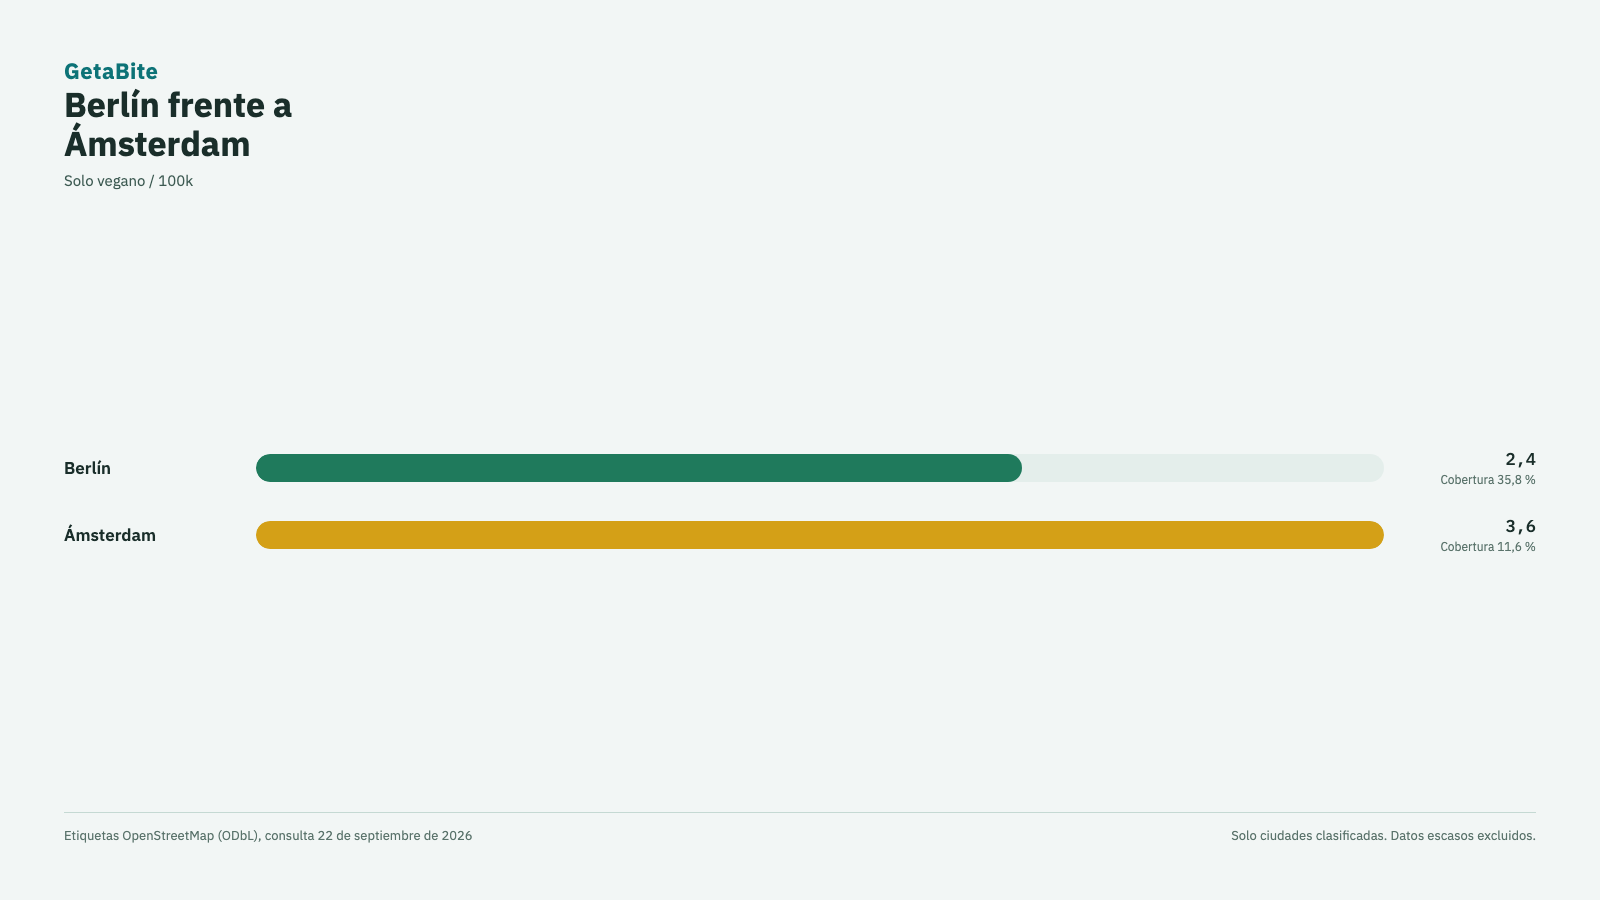
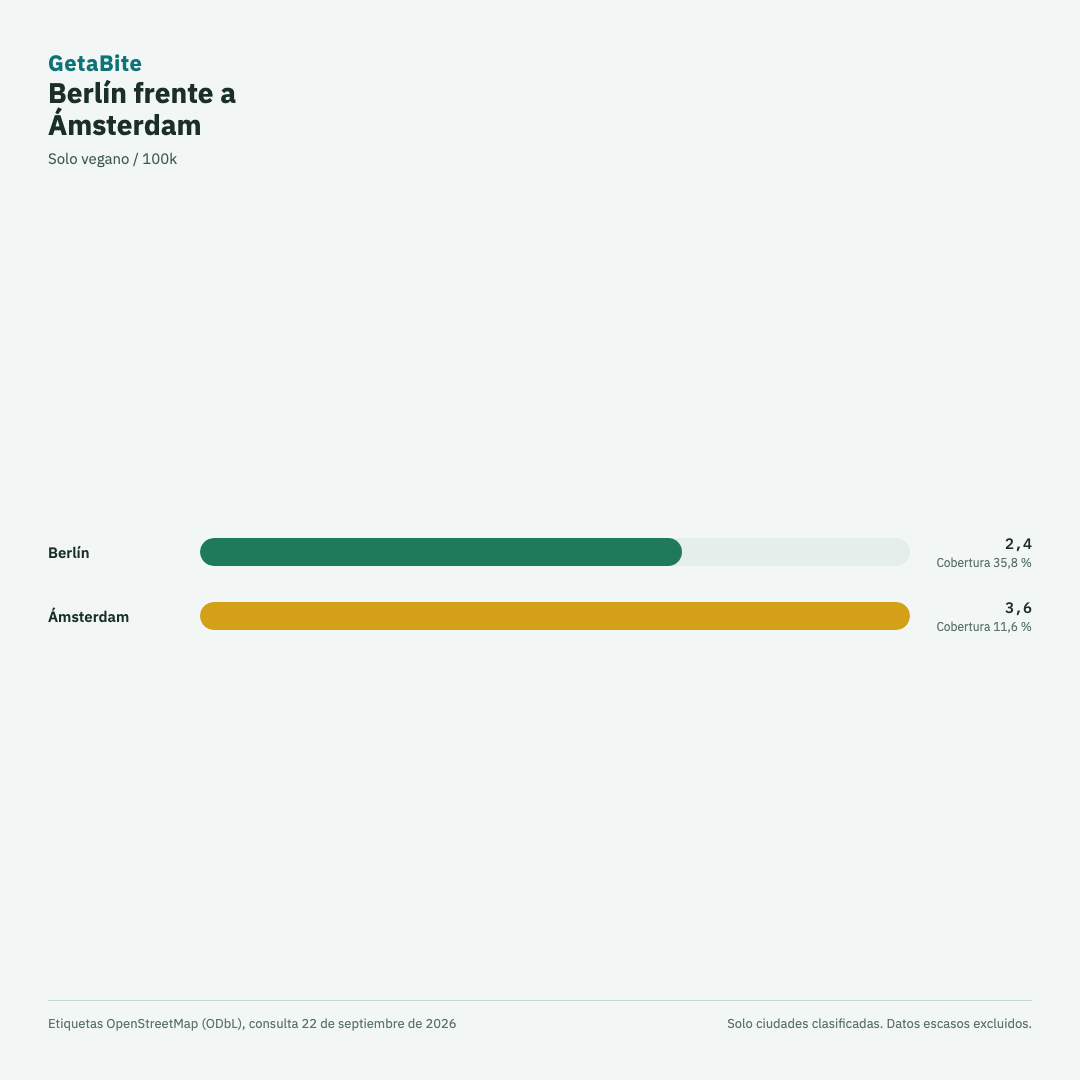
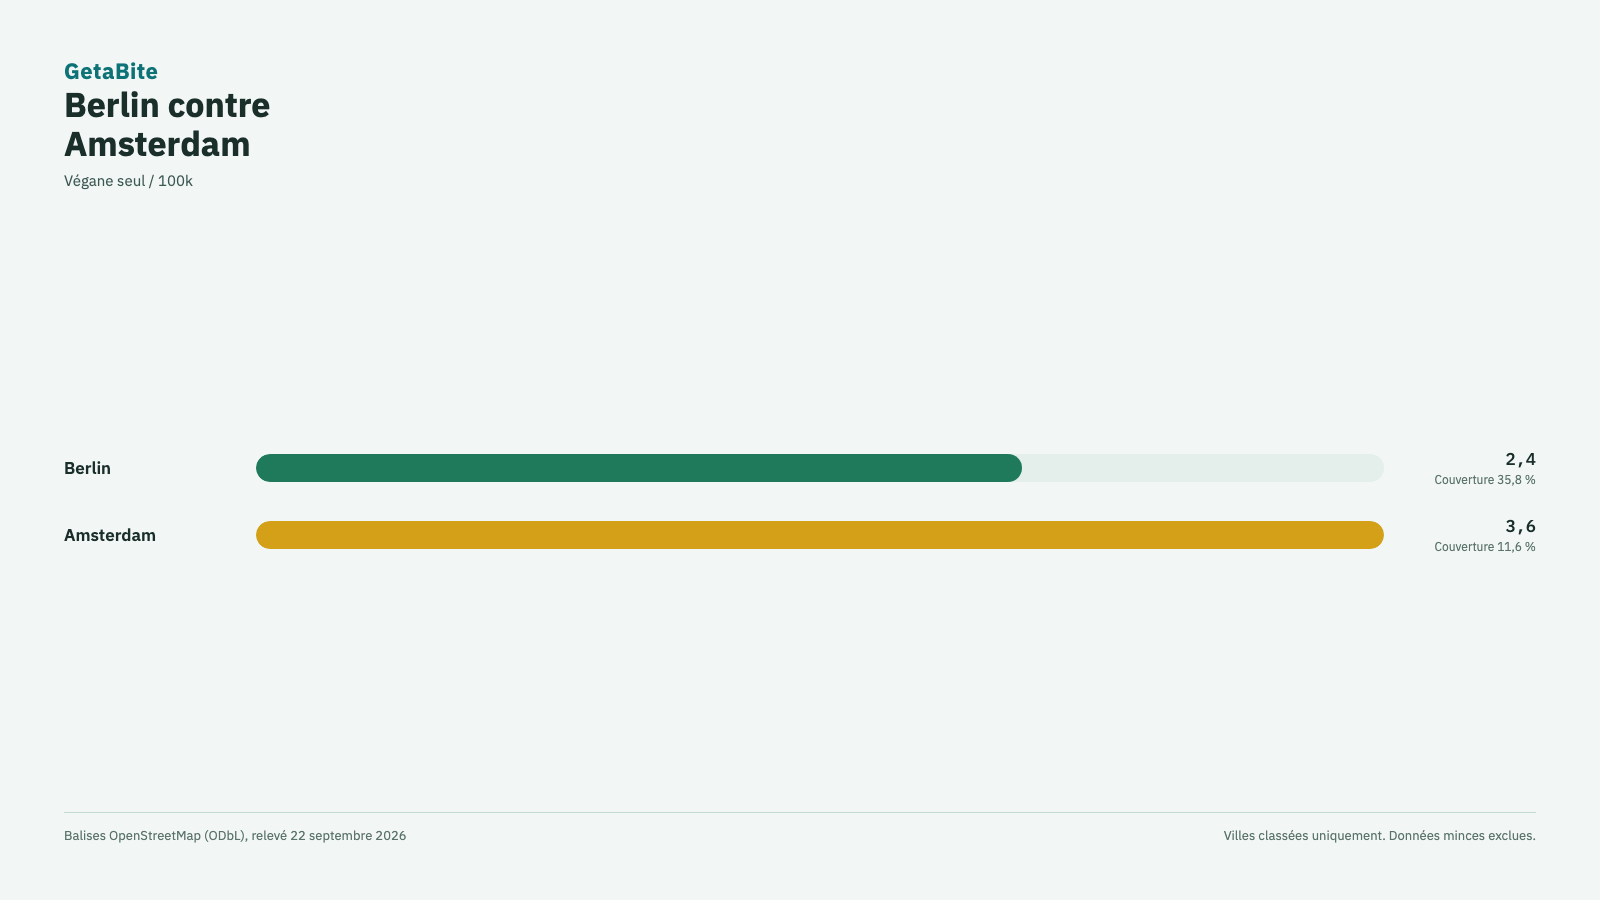
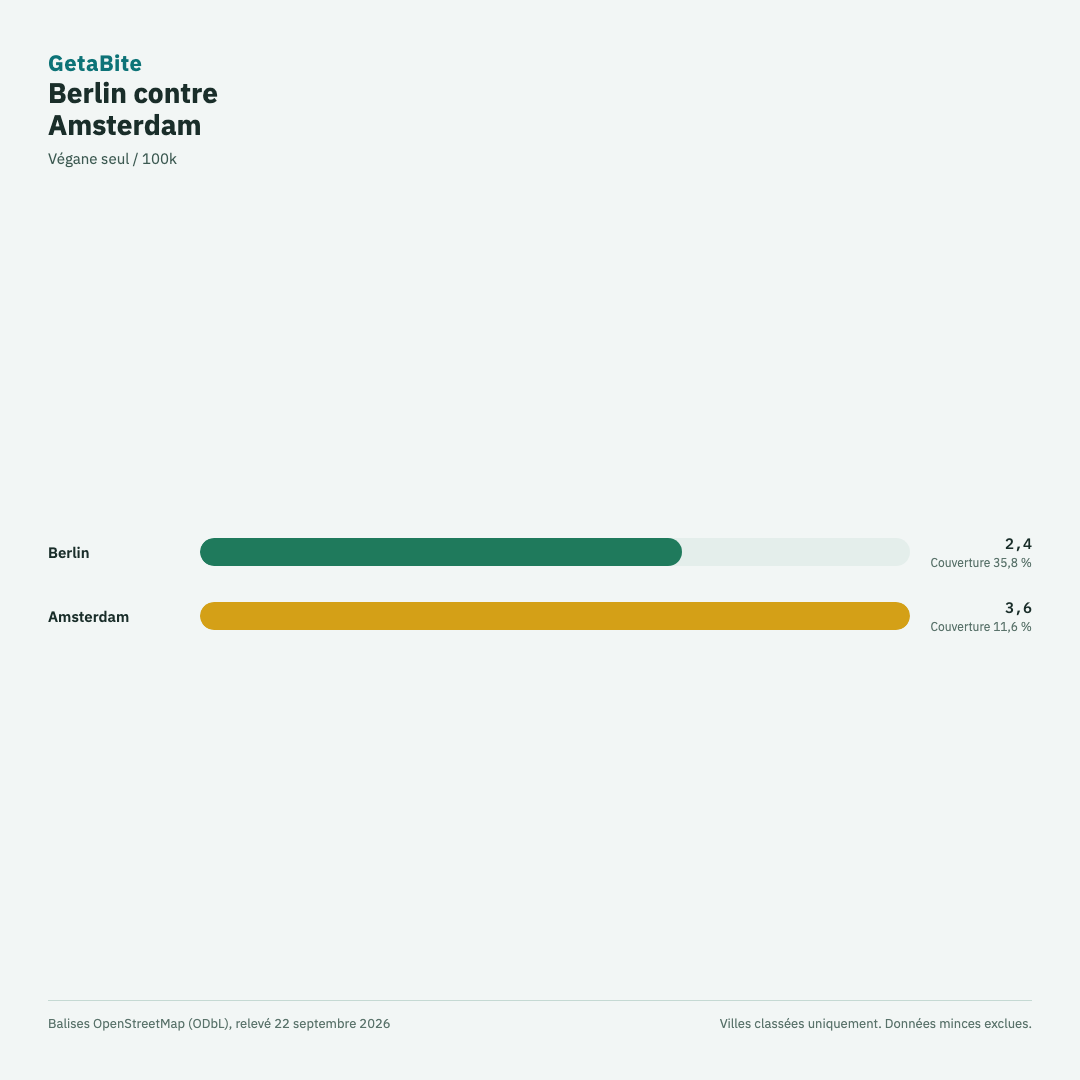
Duel: Berlin vs Amsterdam
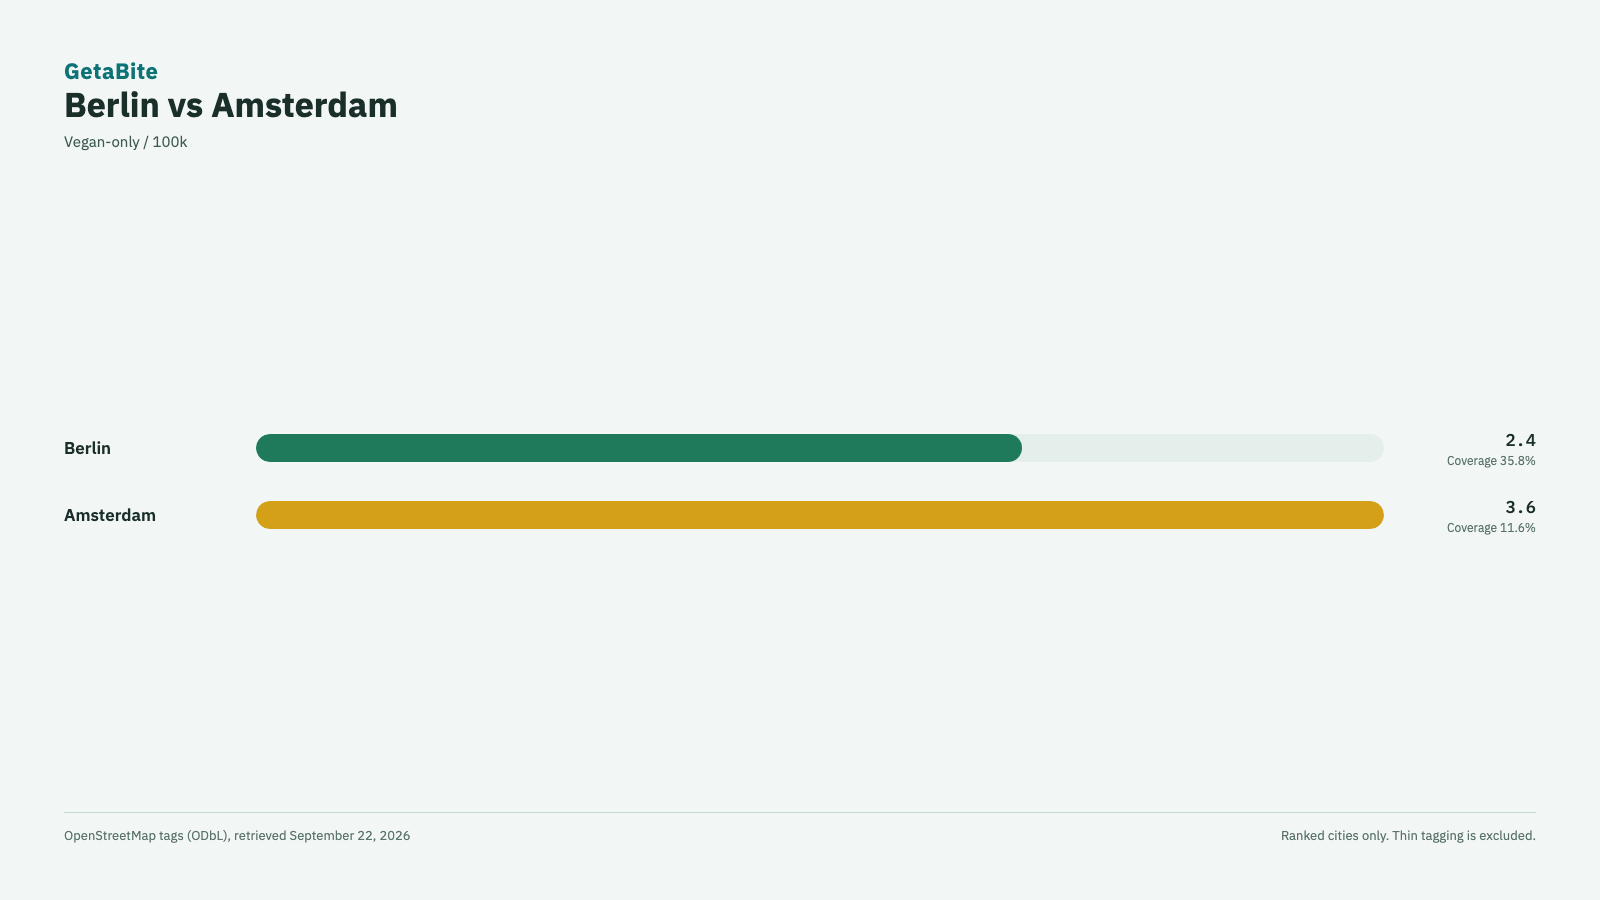
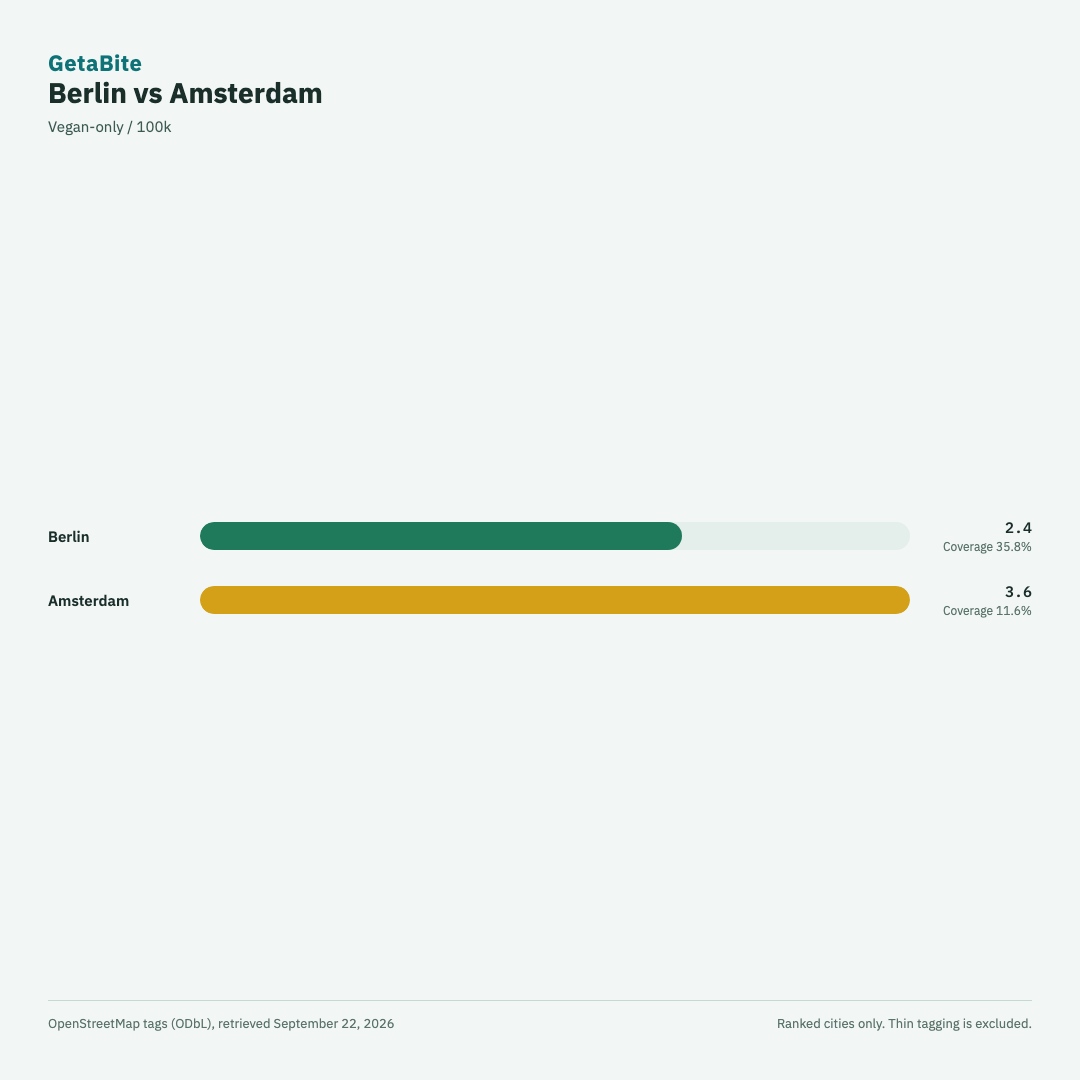
de Landscape · de Square · es Landscape · es Square · fr Landscape · fr Square
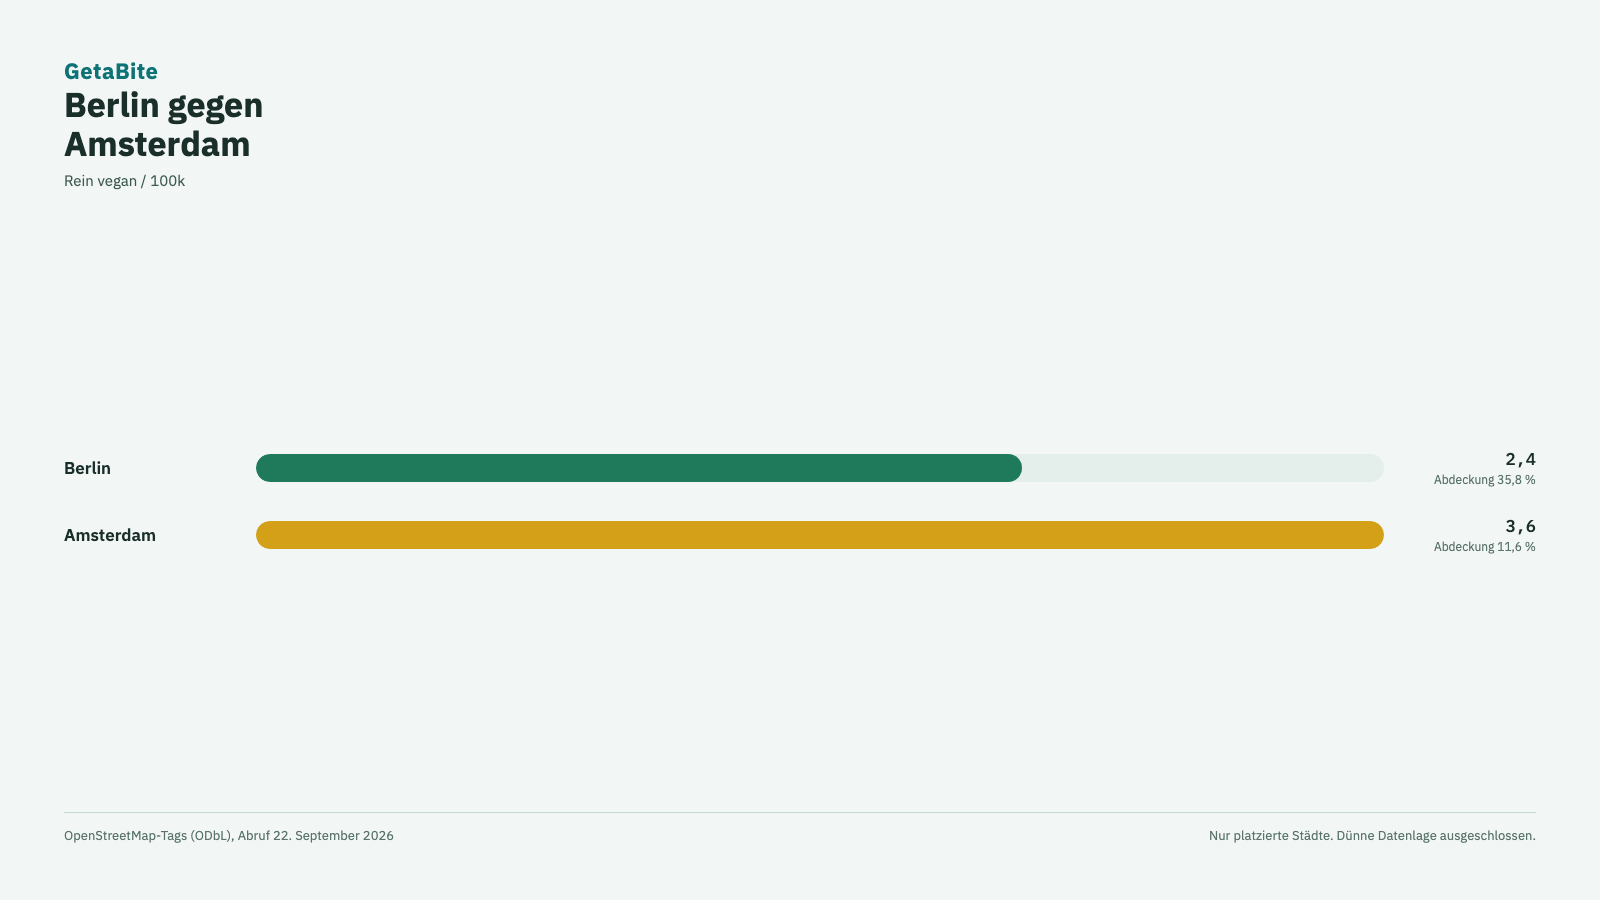
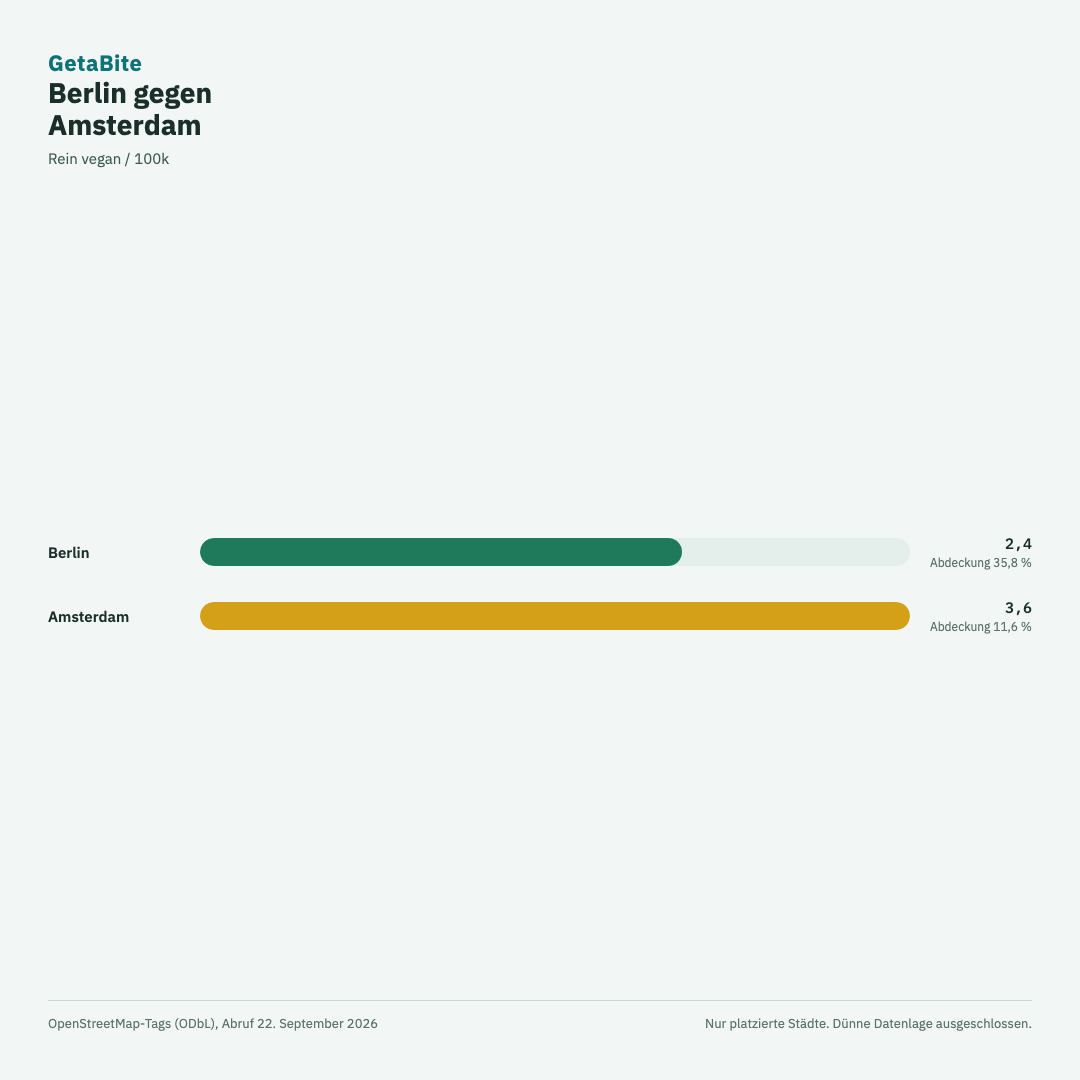
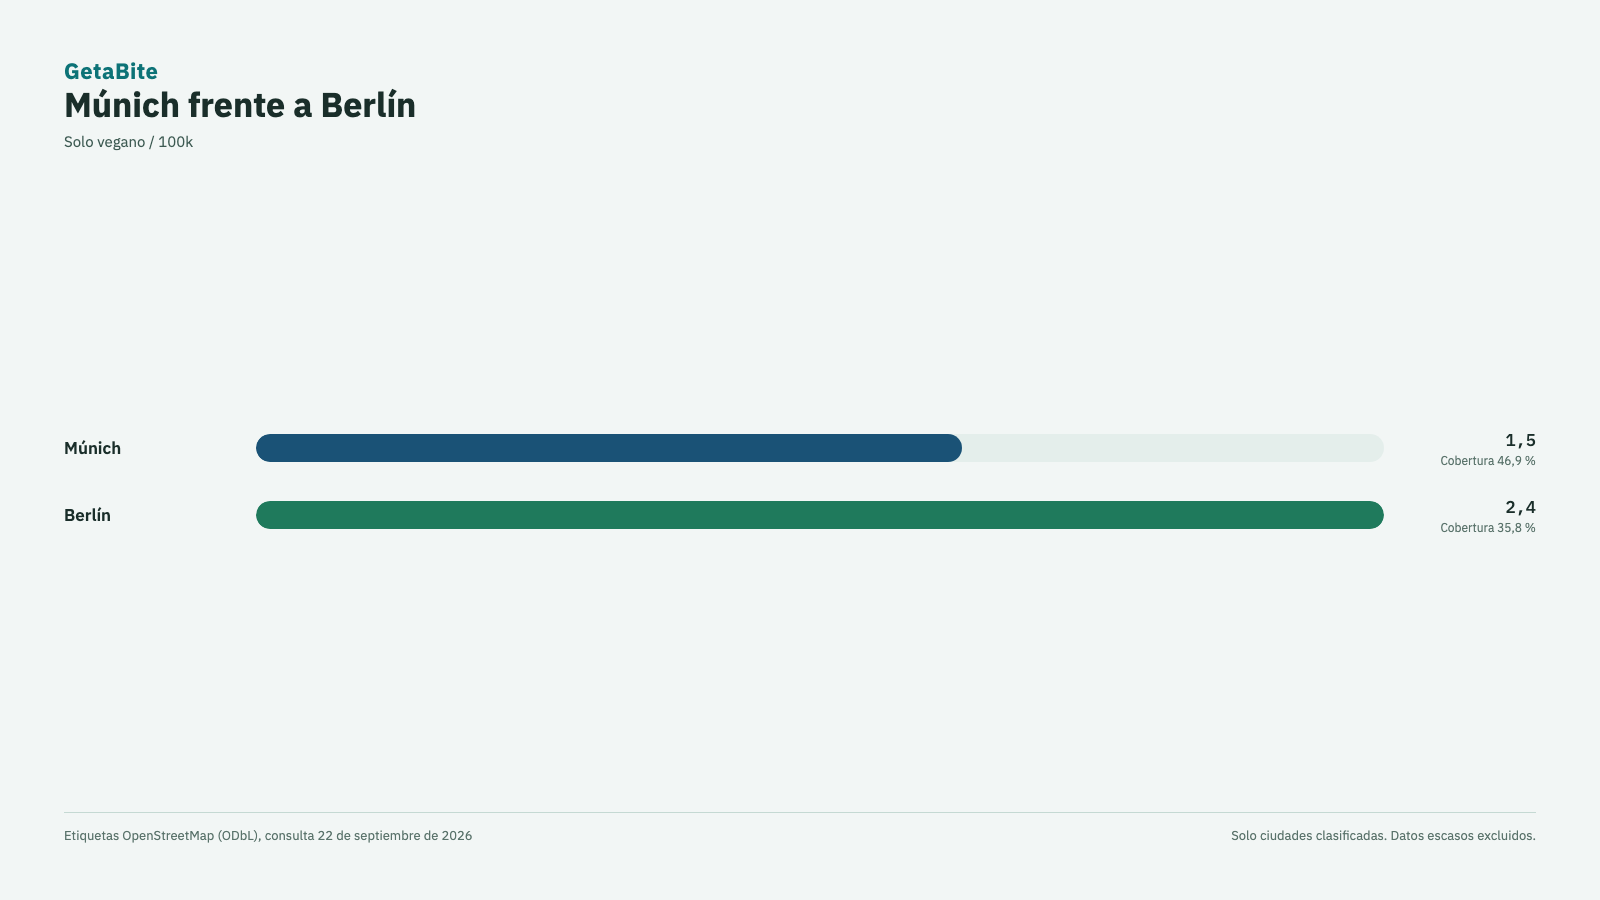
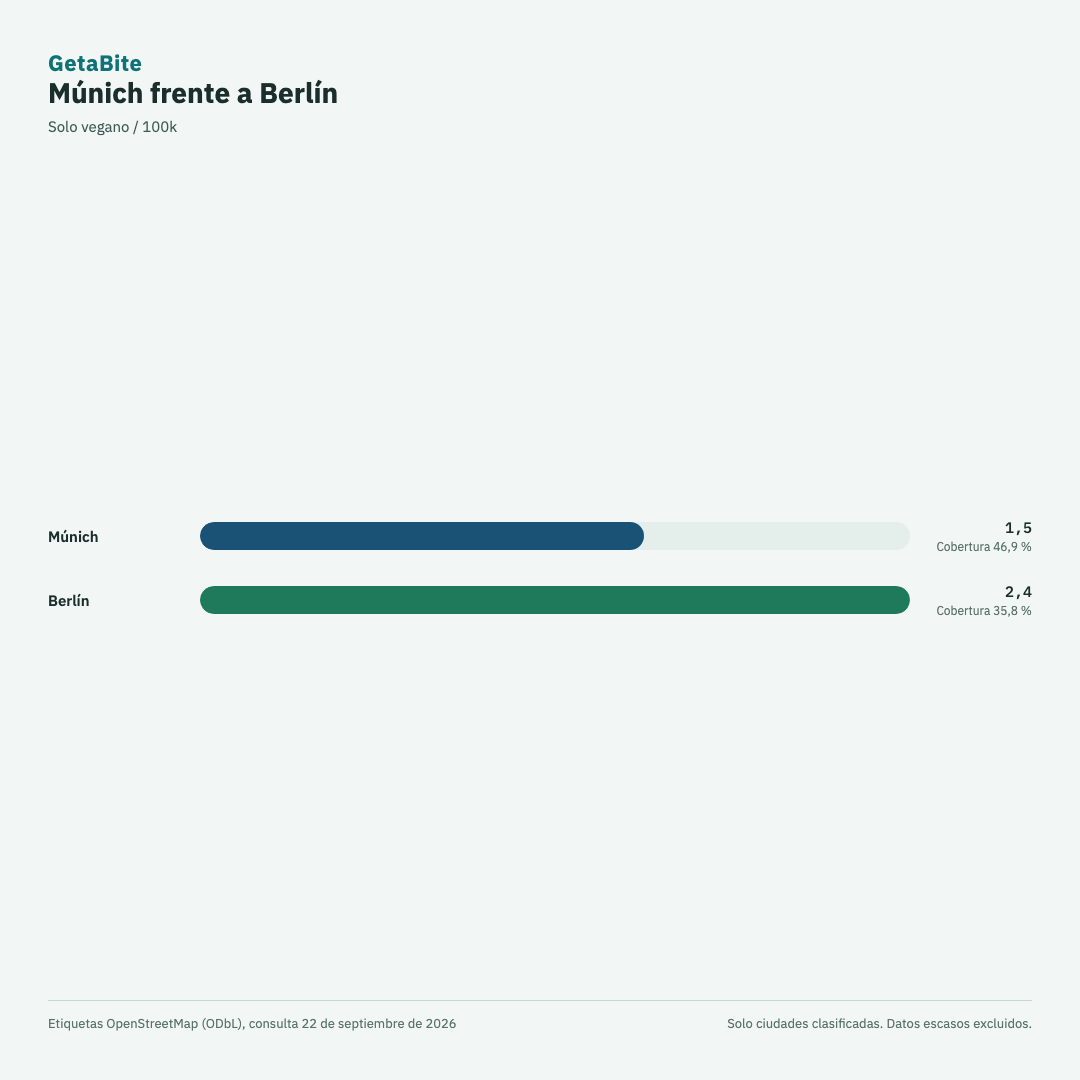
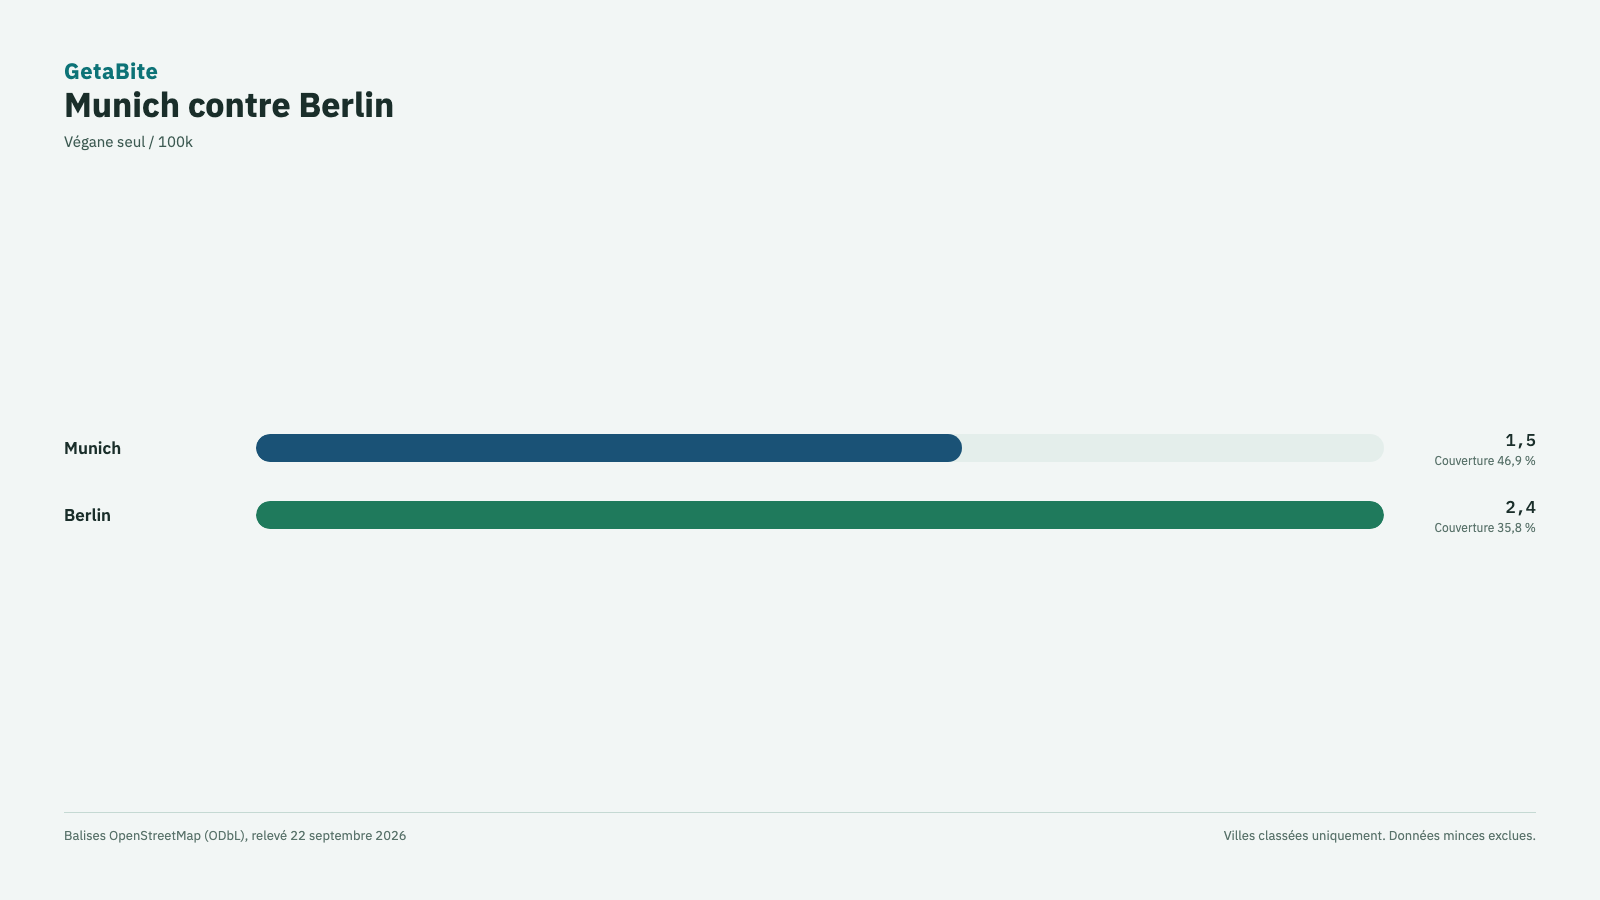
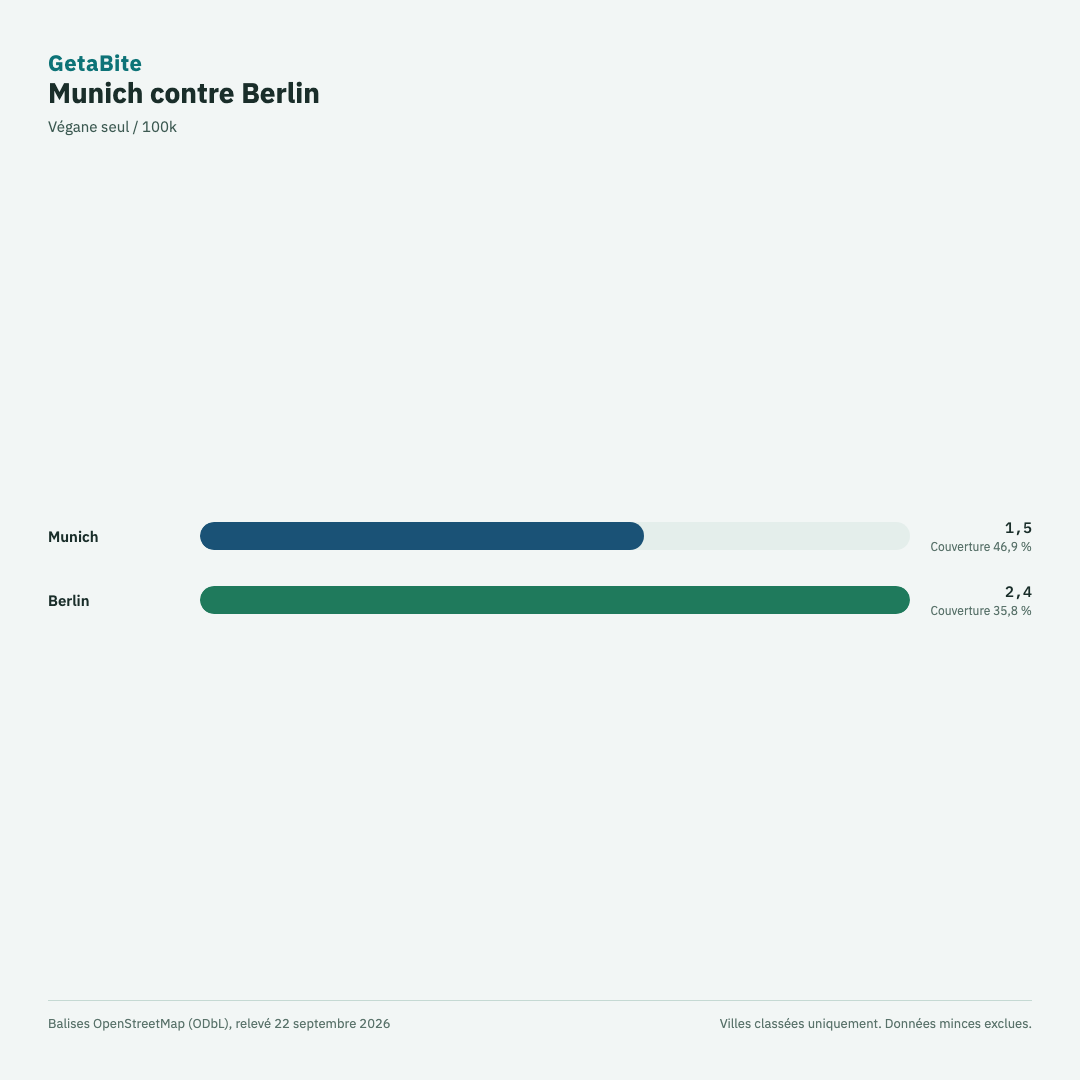
Duel: Munich vs Berlin
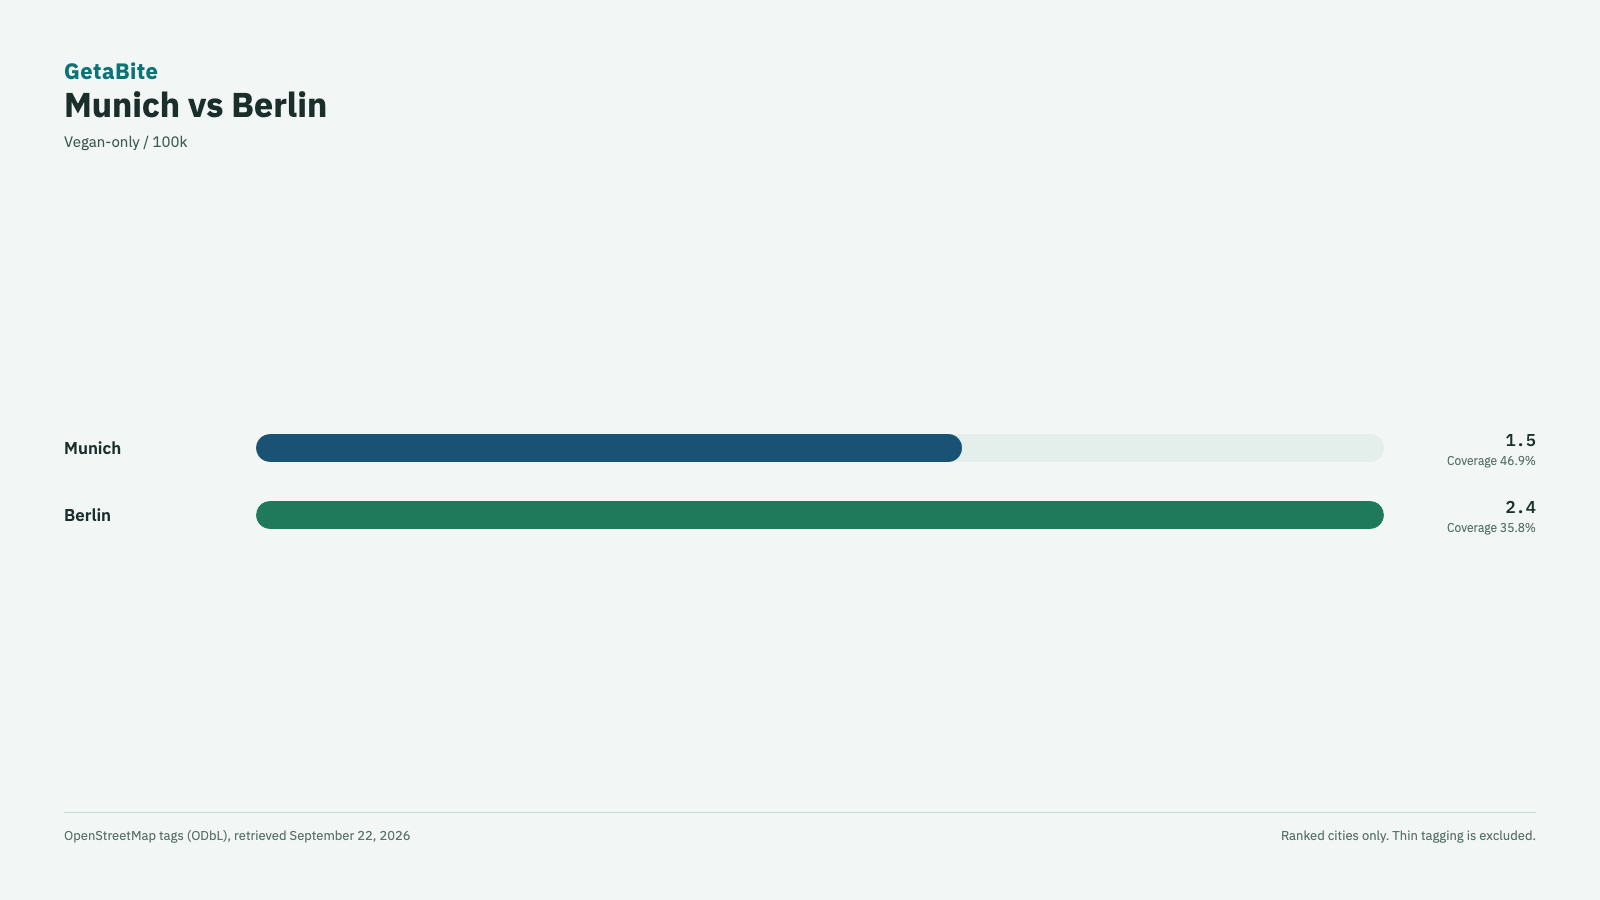
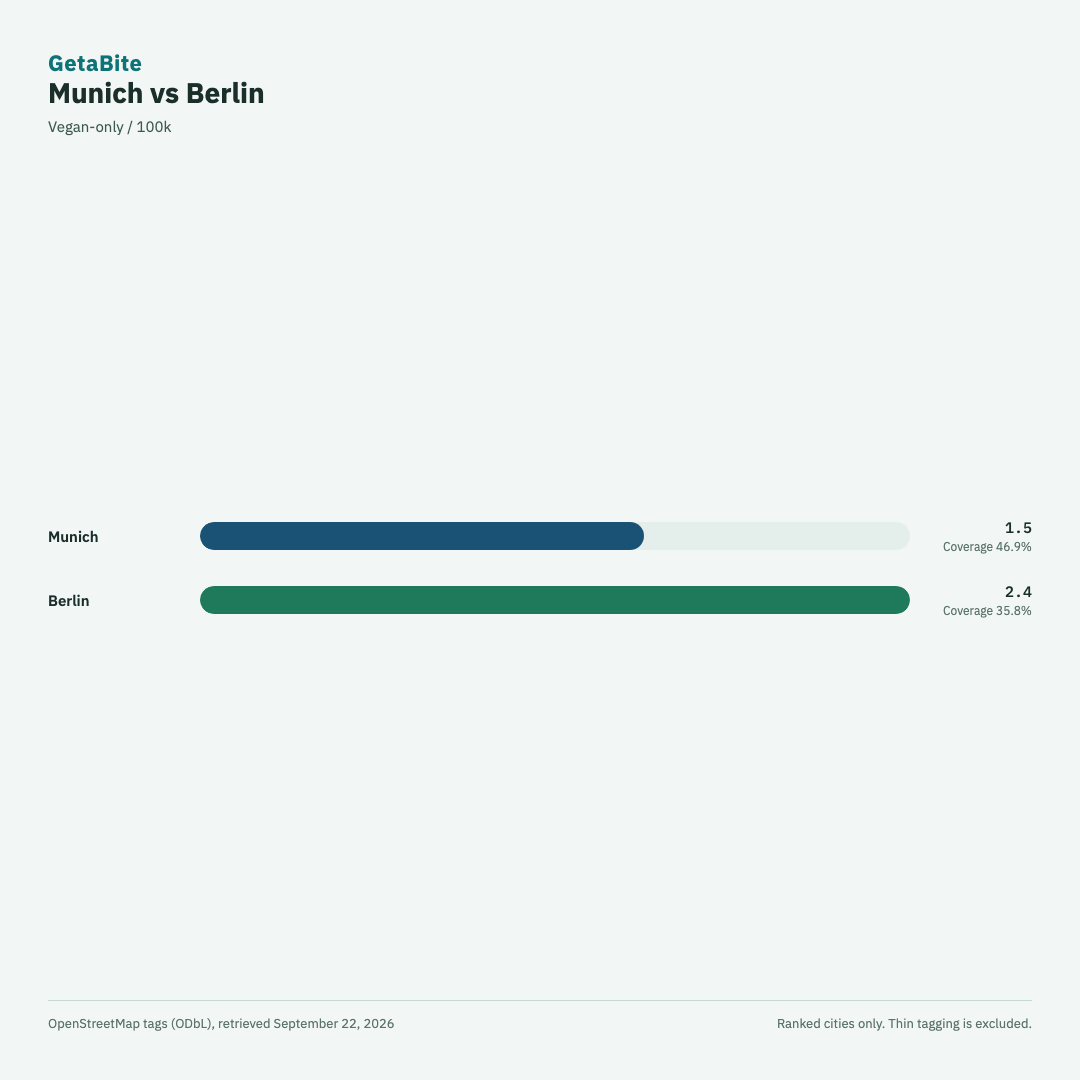
de Landscape · de Square · es Landscape · es Square · fr Landscape · fr Square
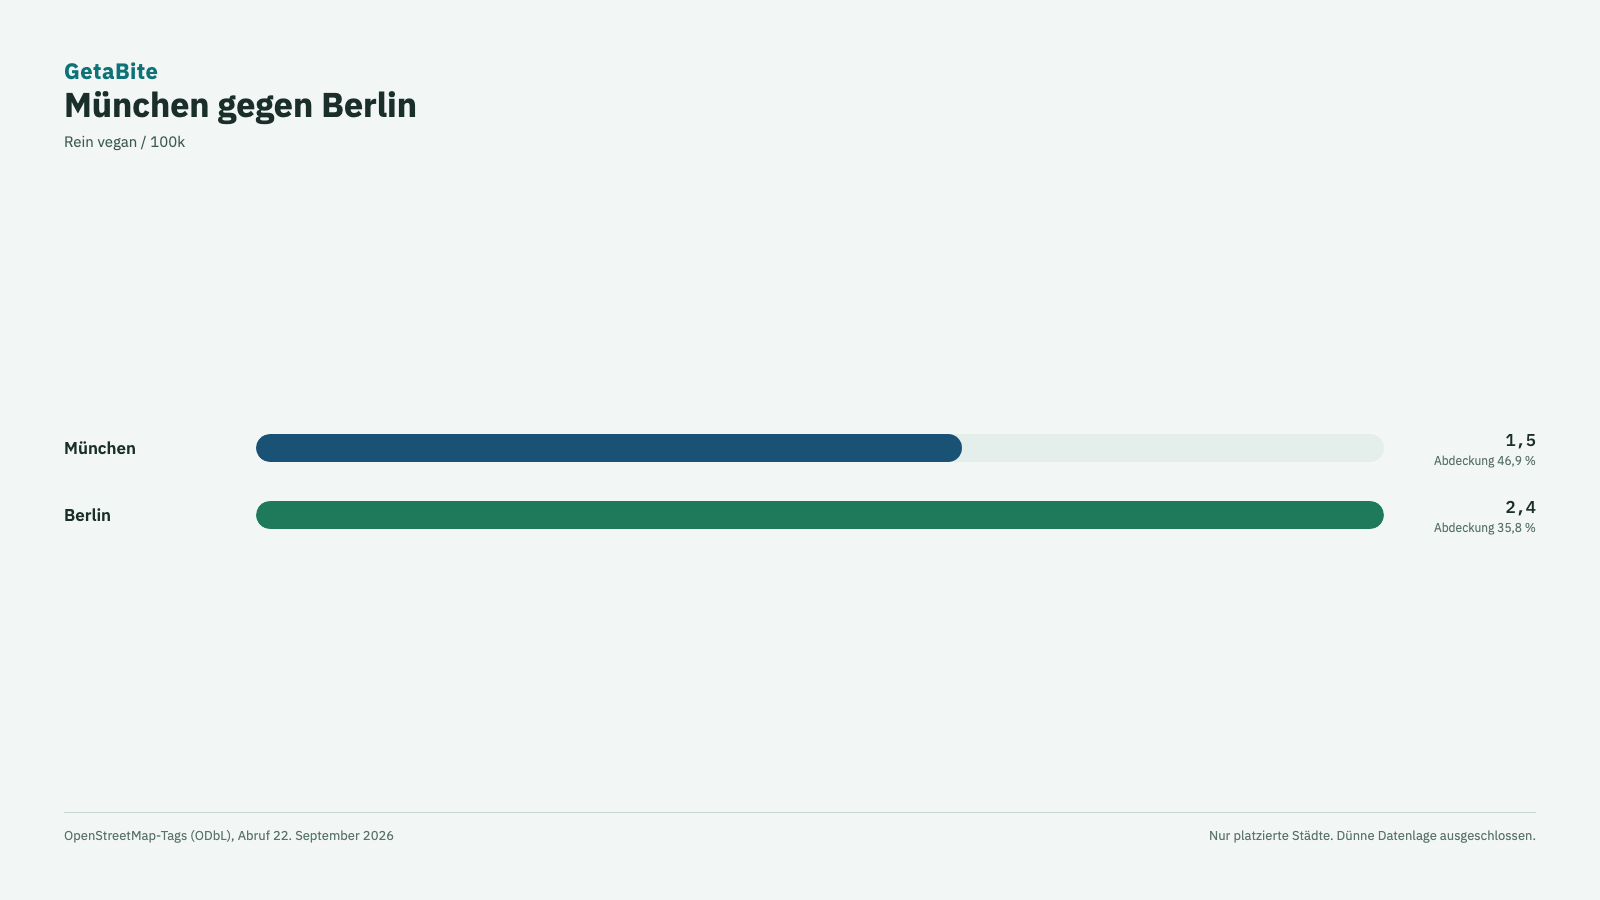
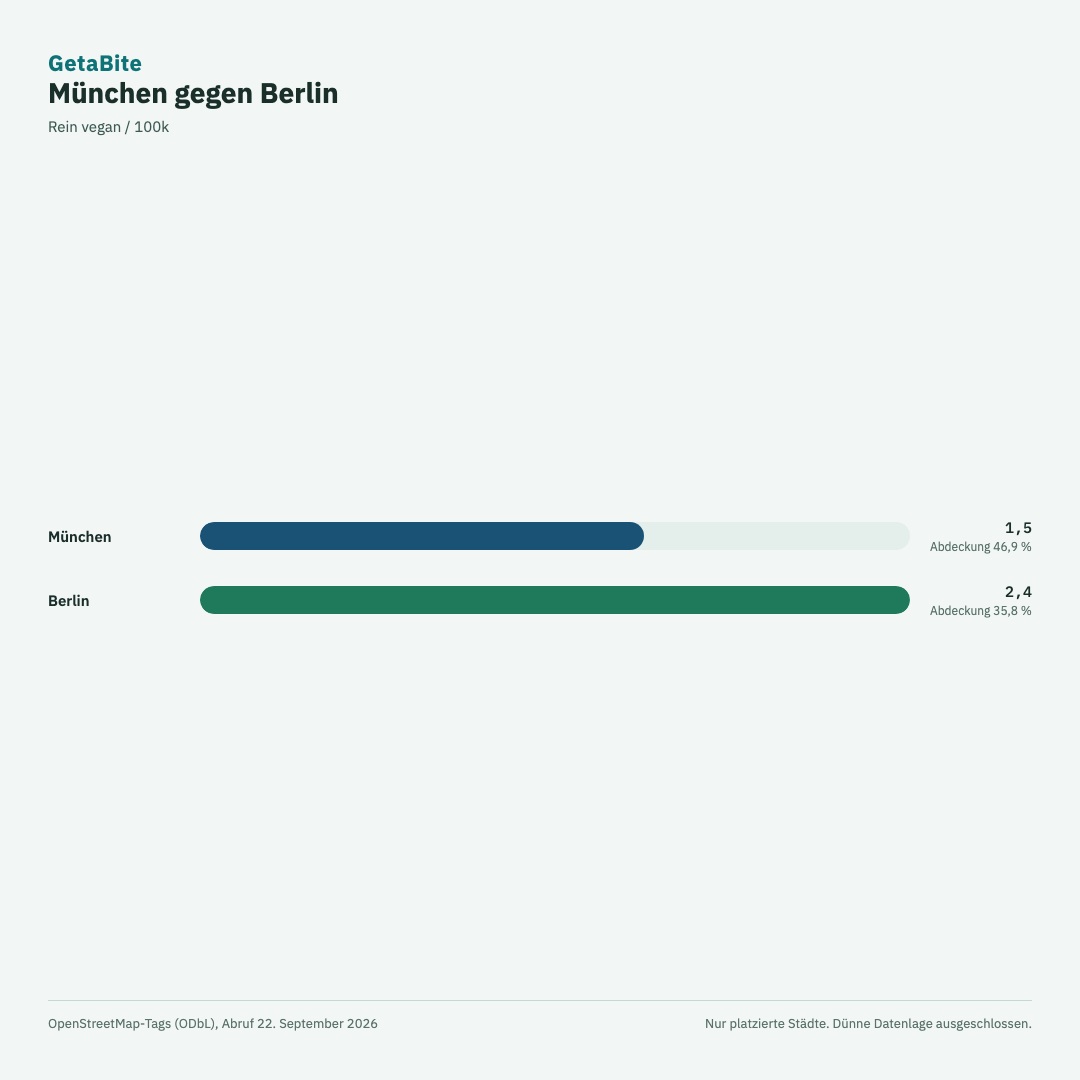
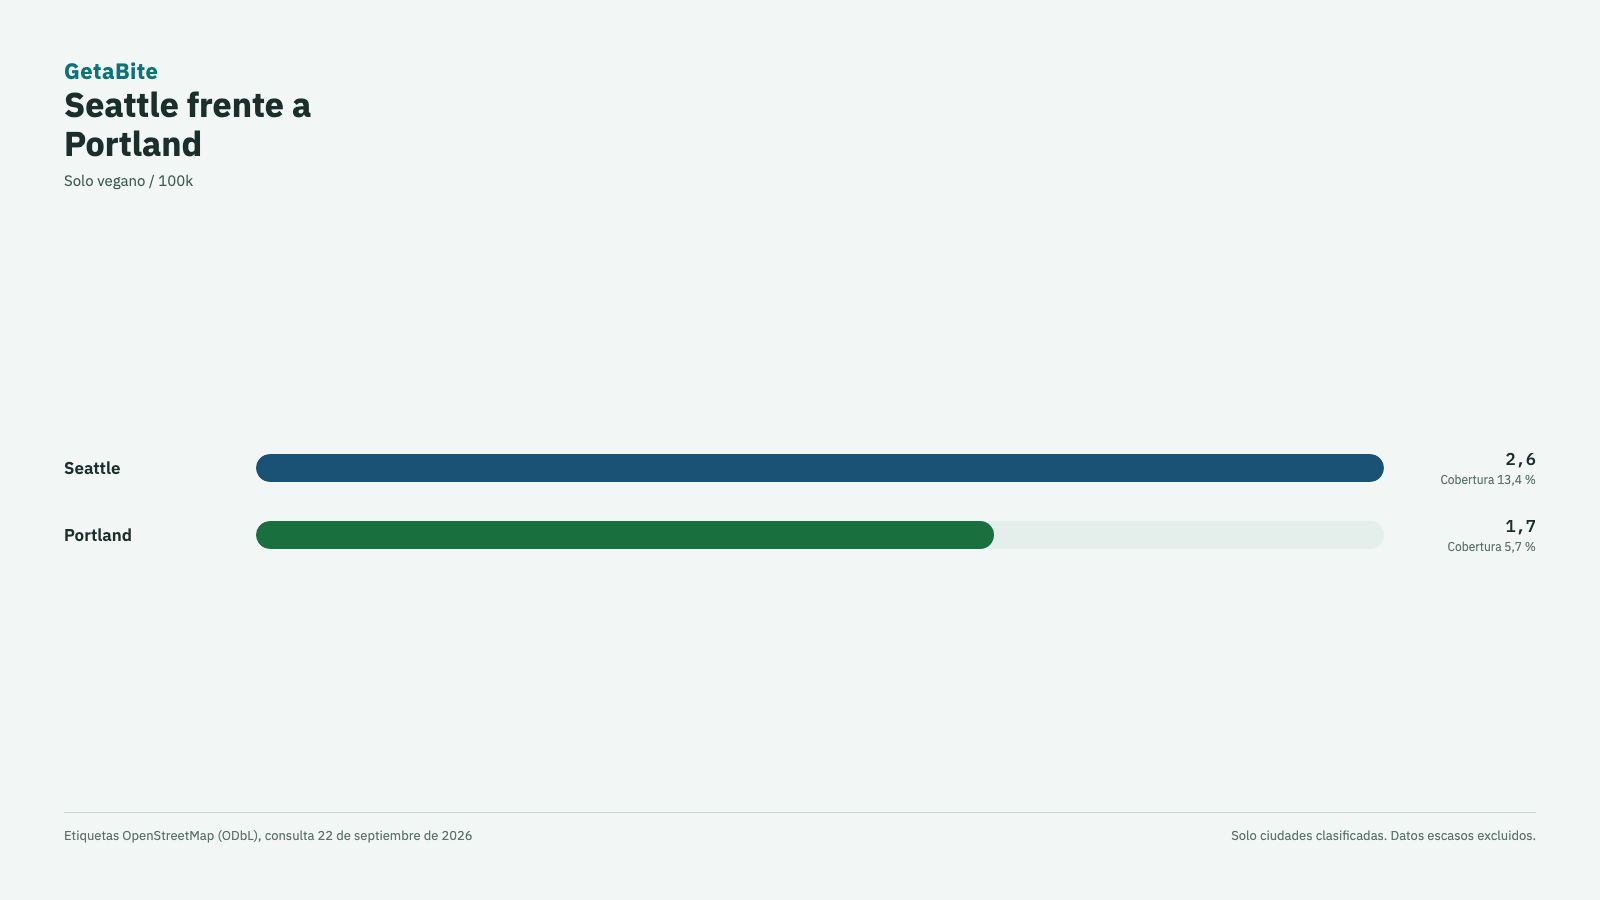
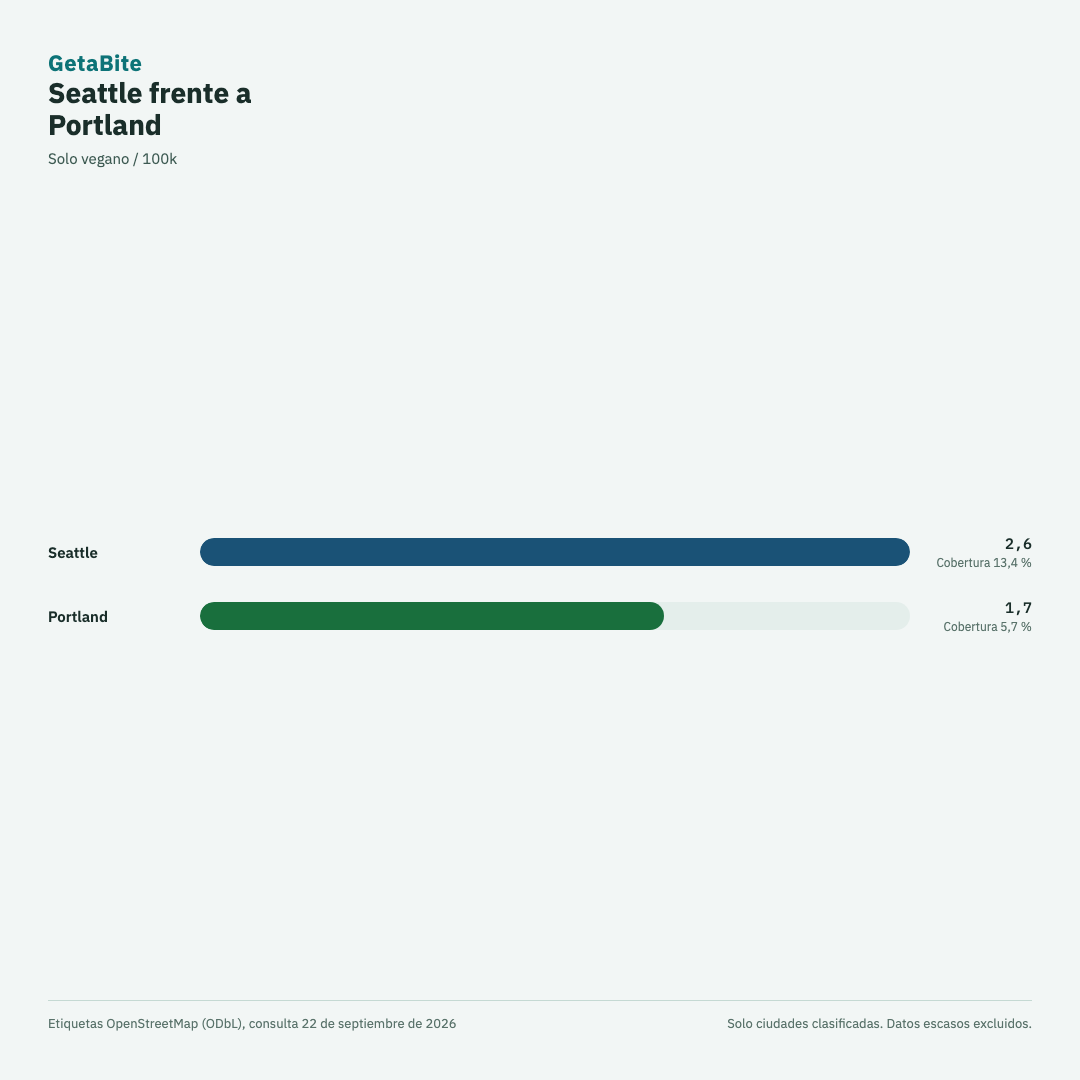
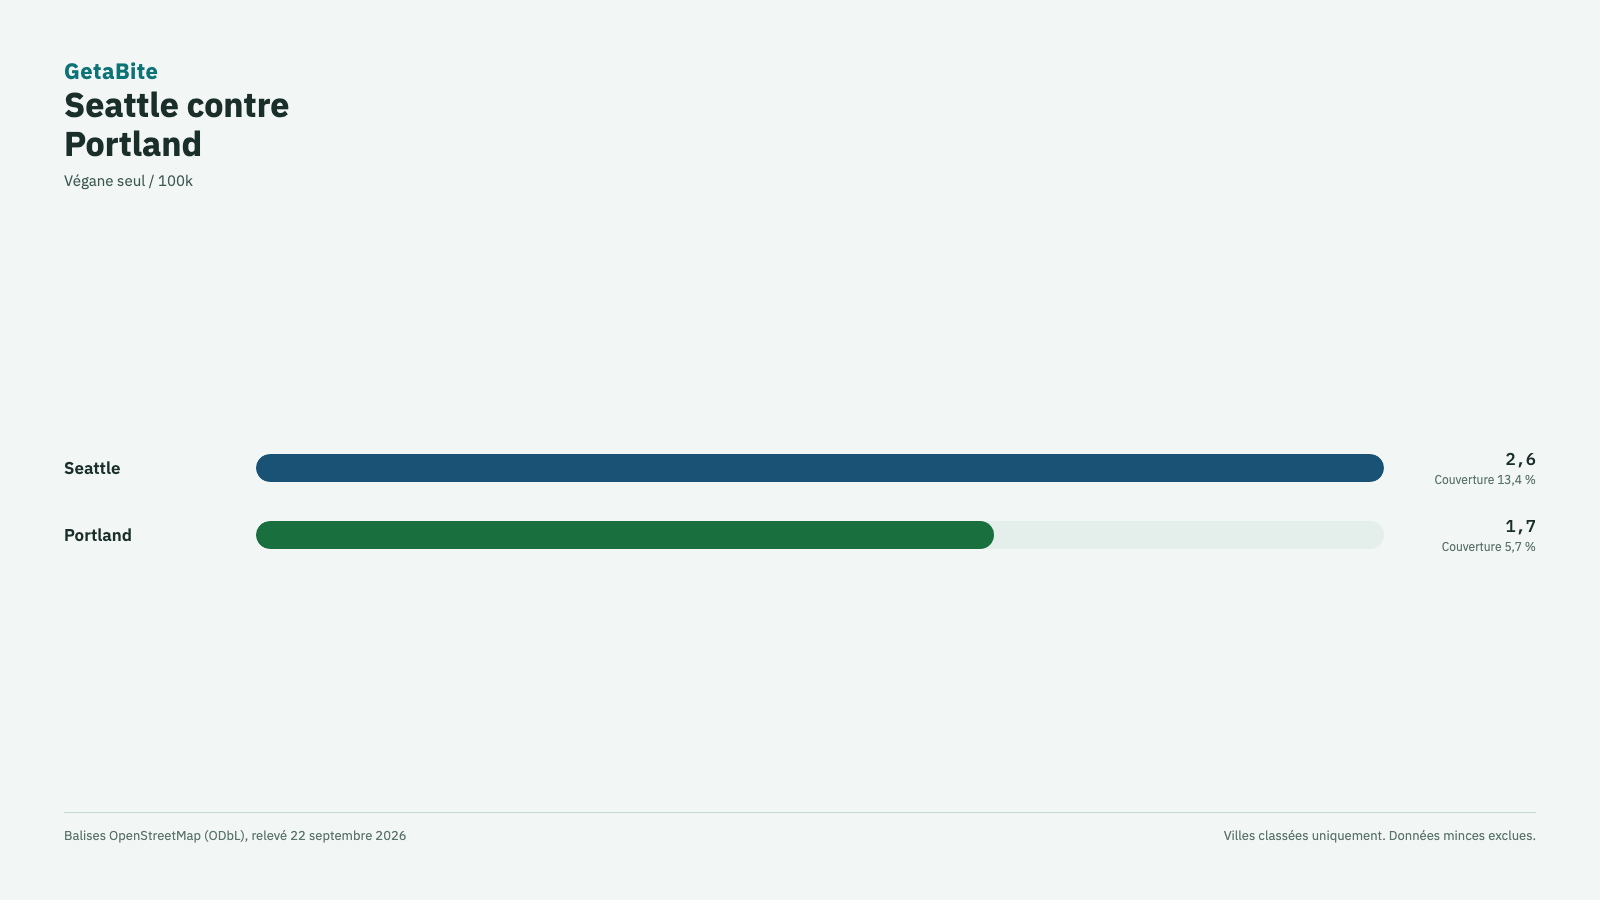
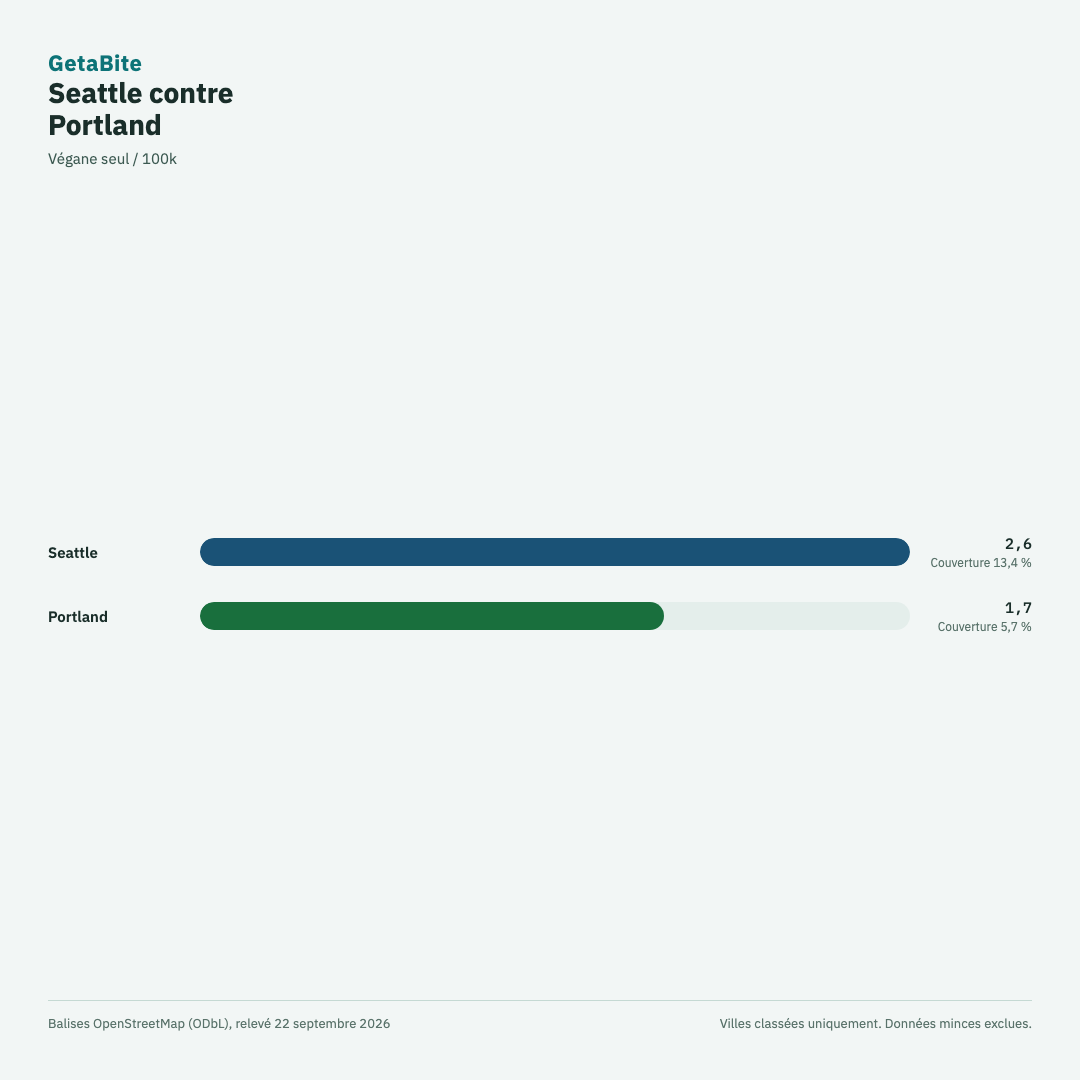
Duel: Seattle vs Portland
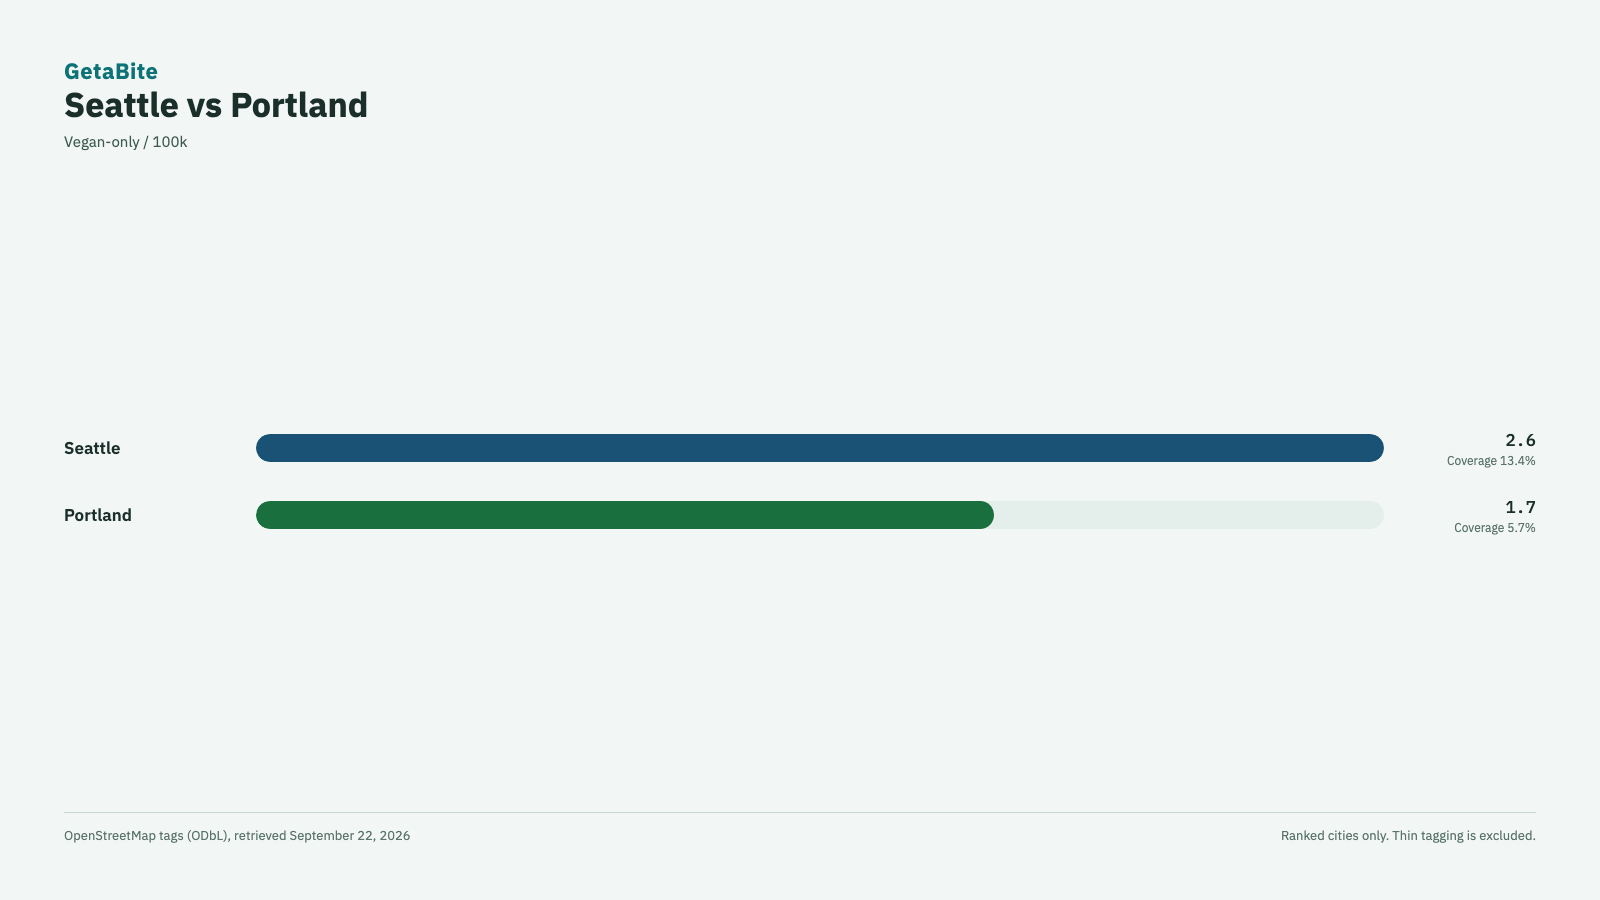
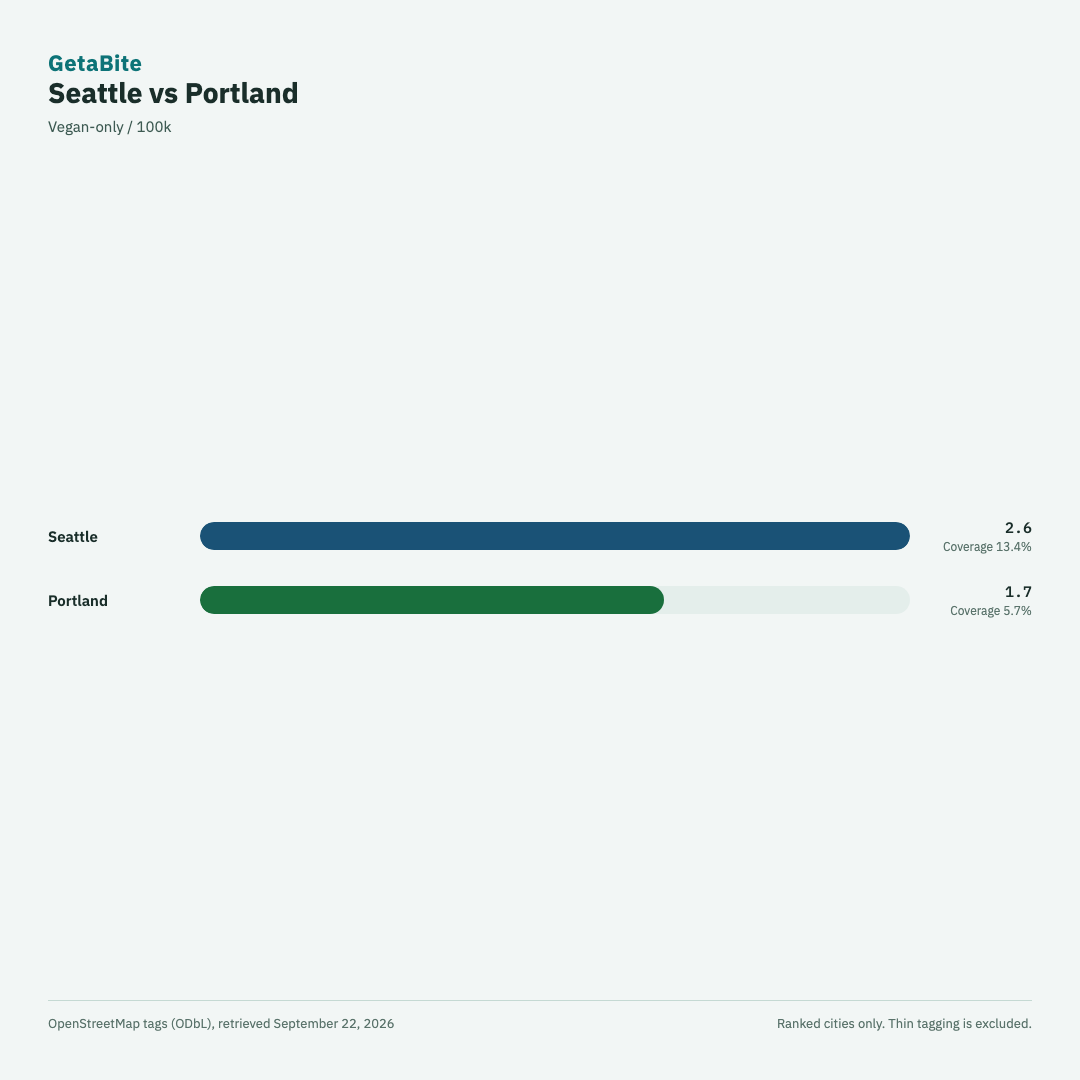
de Landscape · de Square · es Landscape · es Square · fr Landscape · fr Square
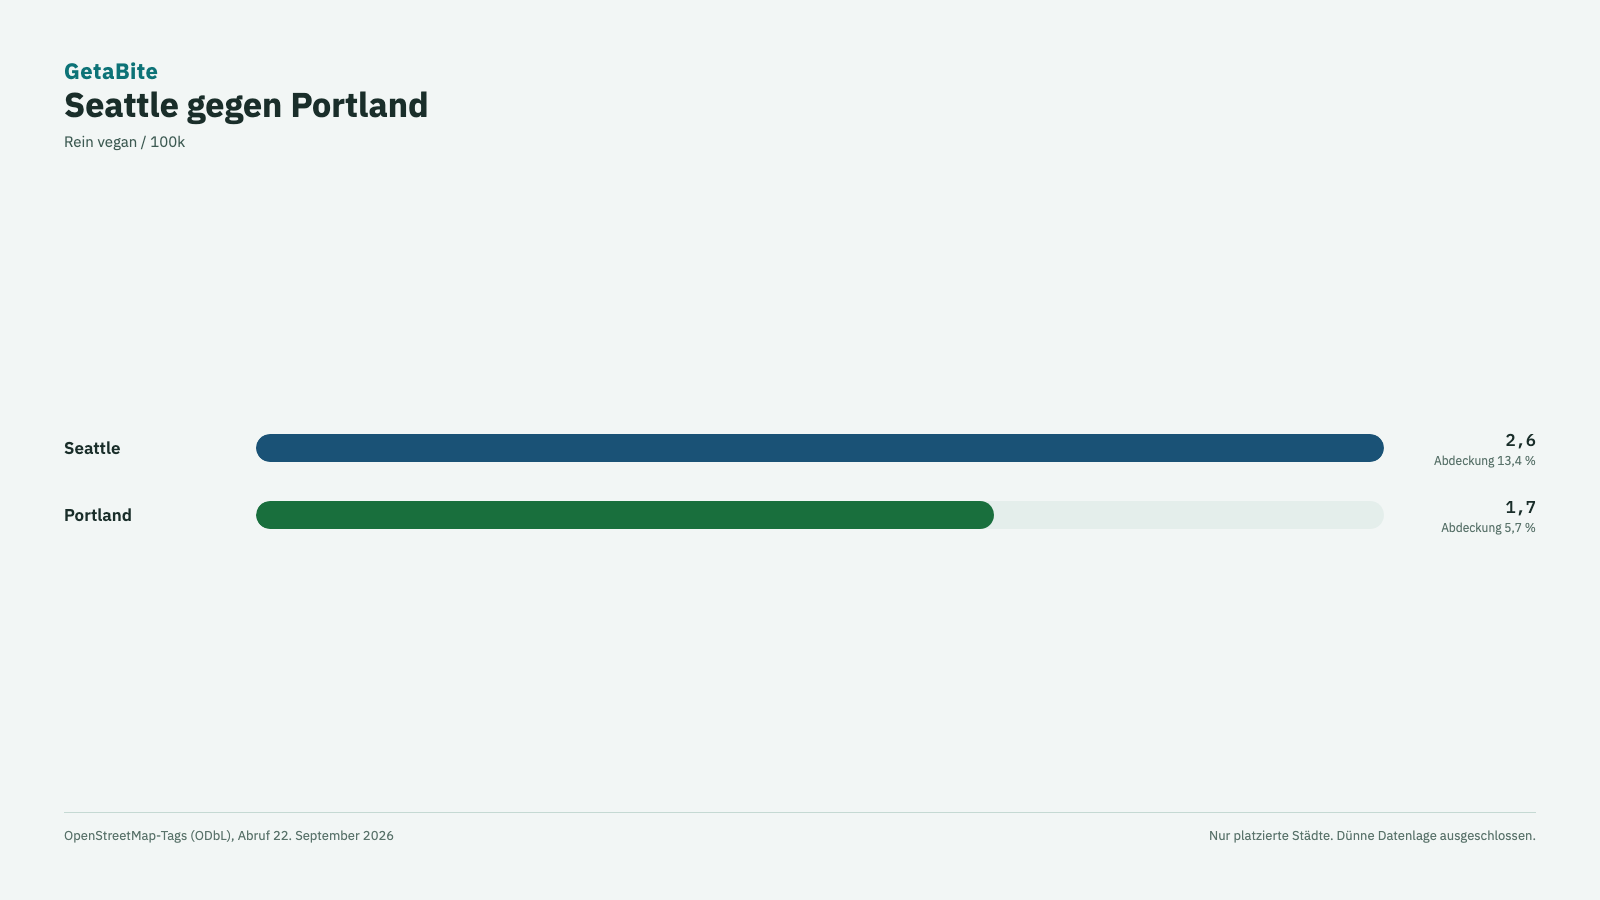
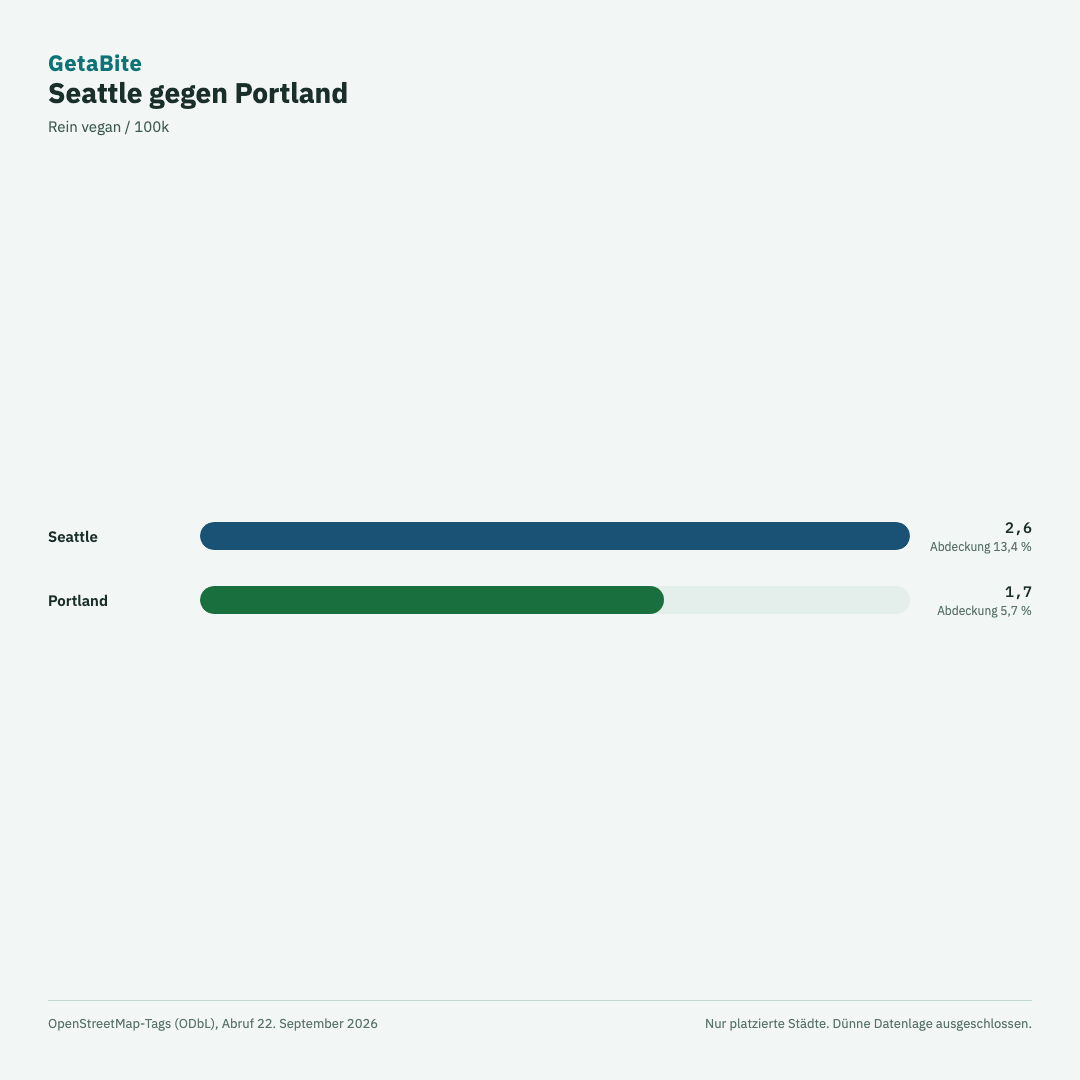
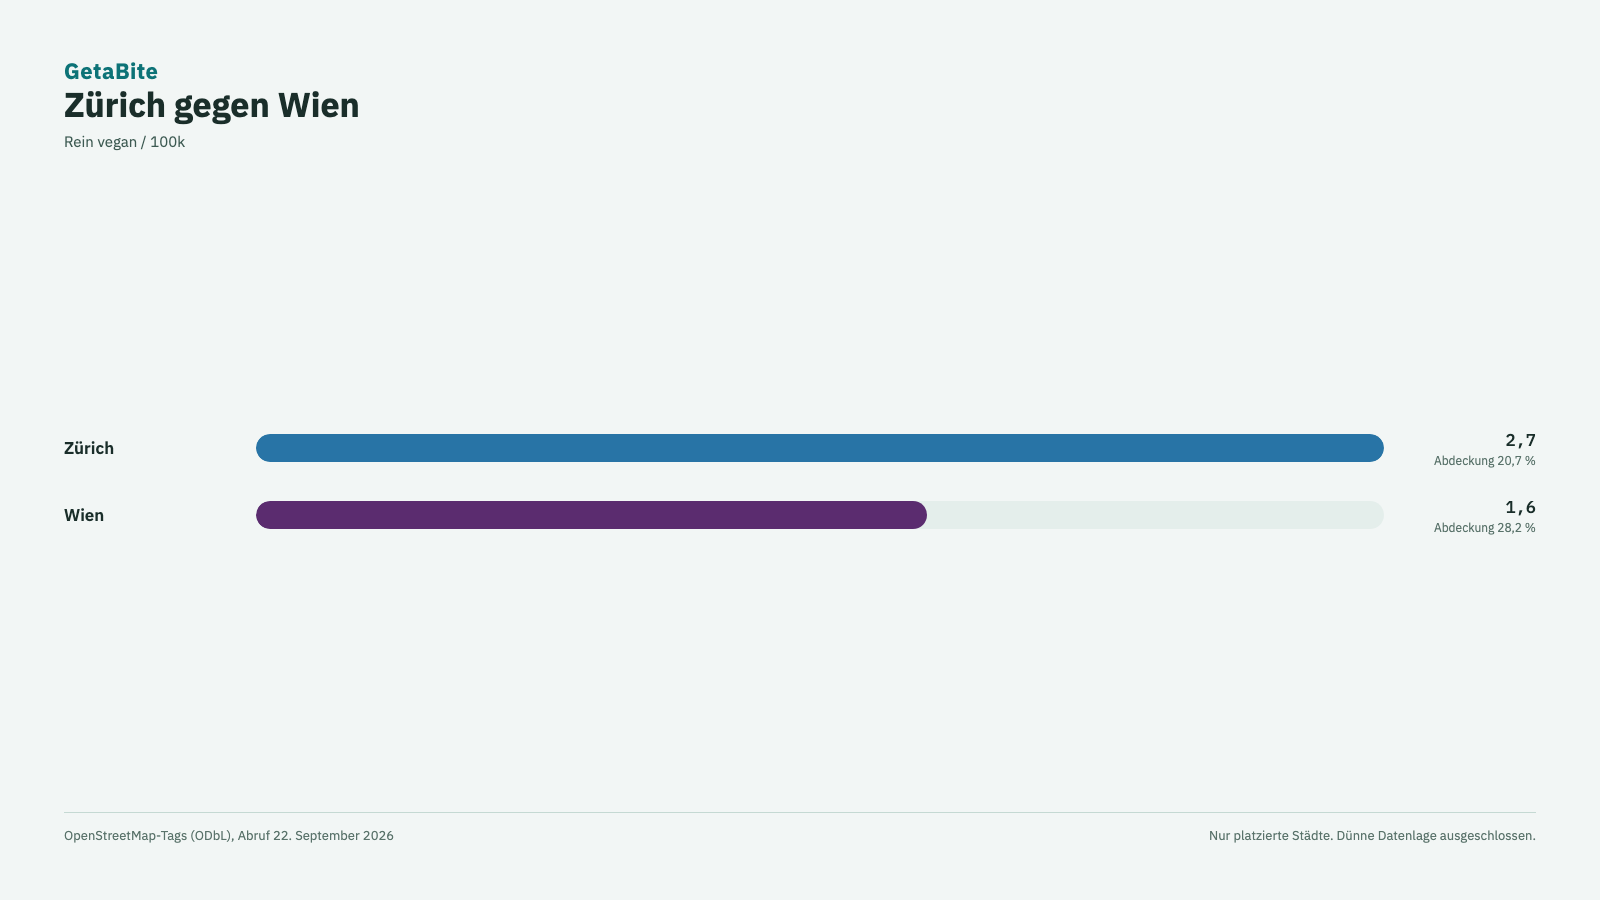
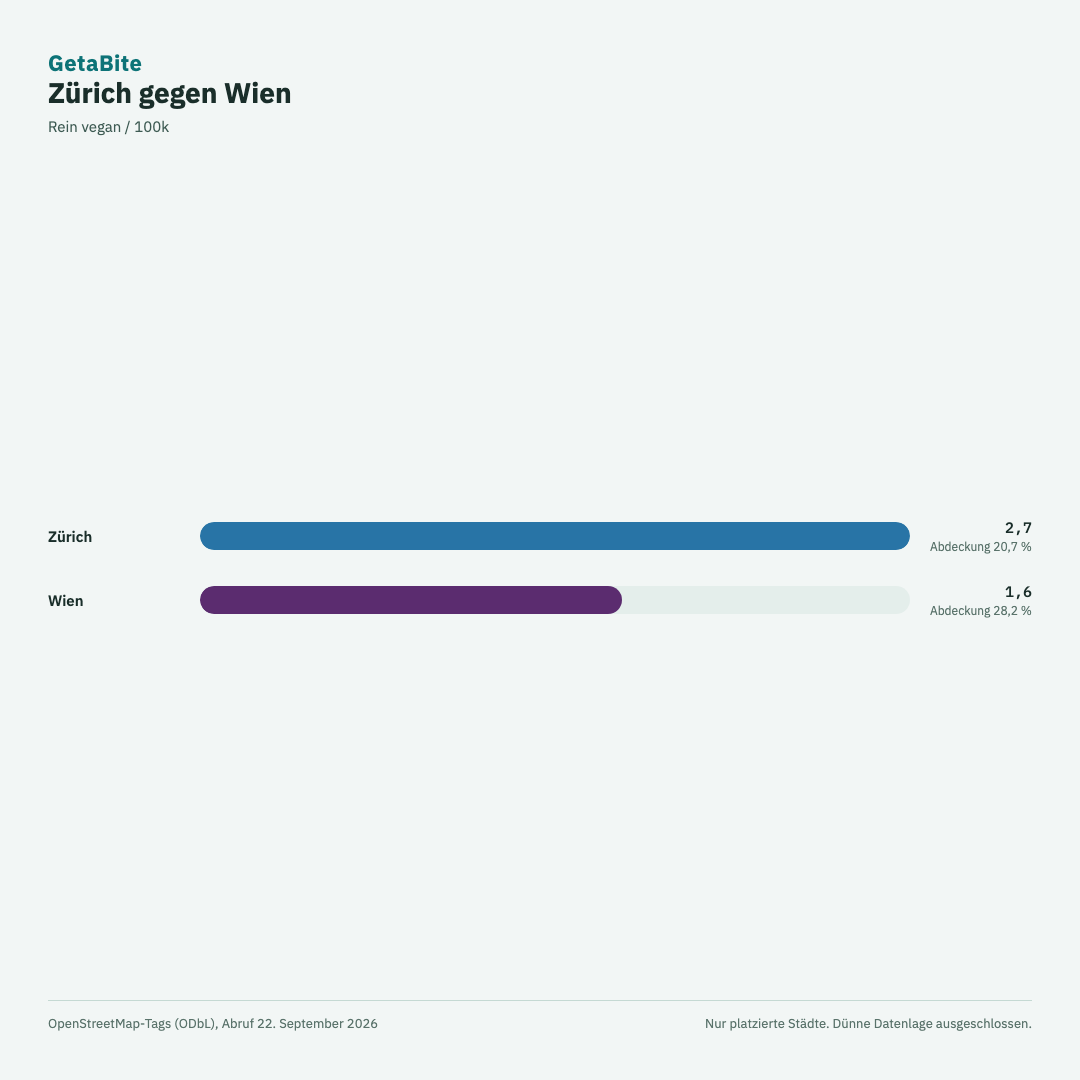
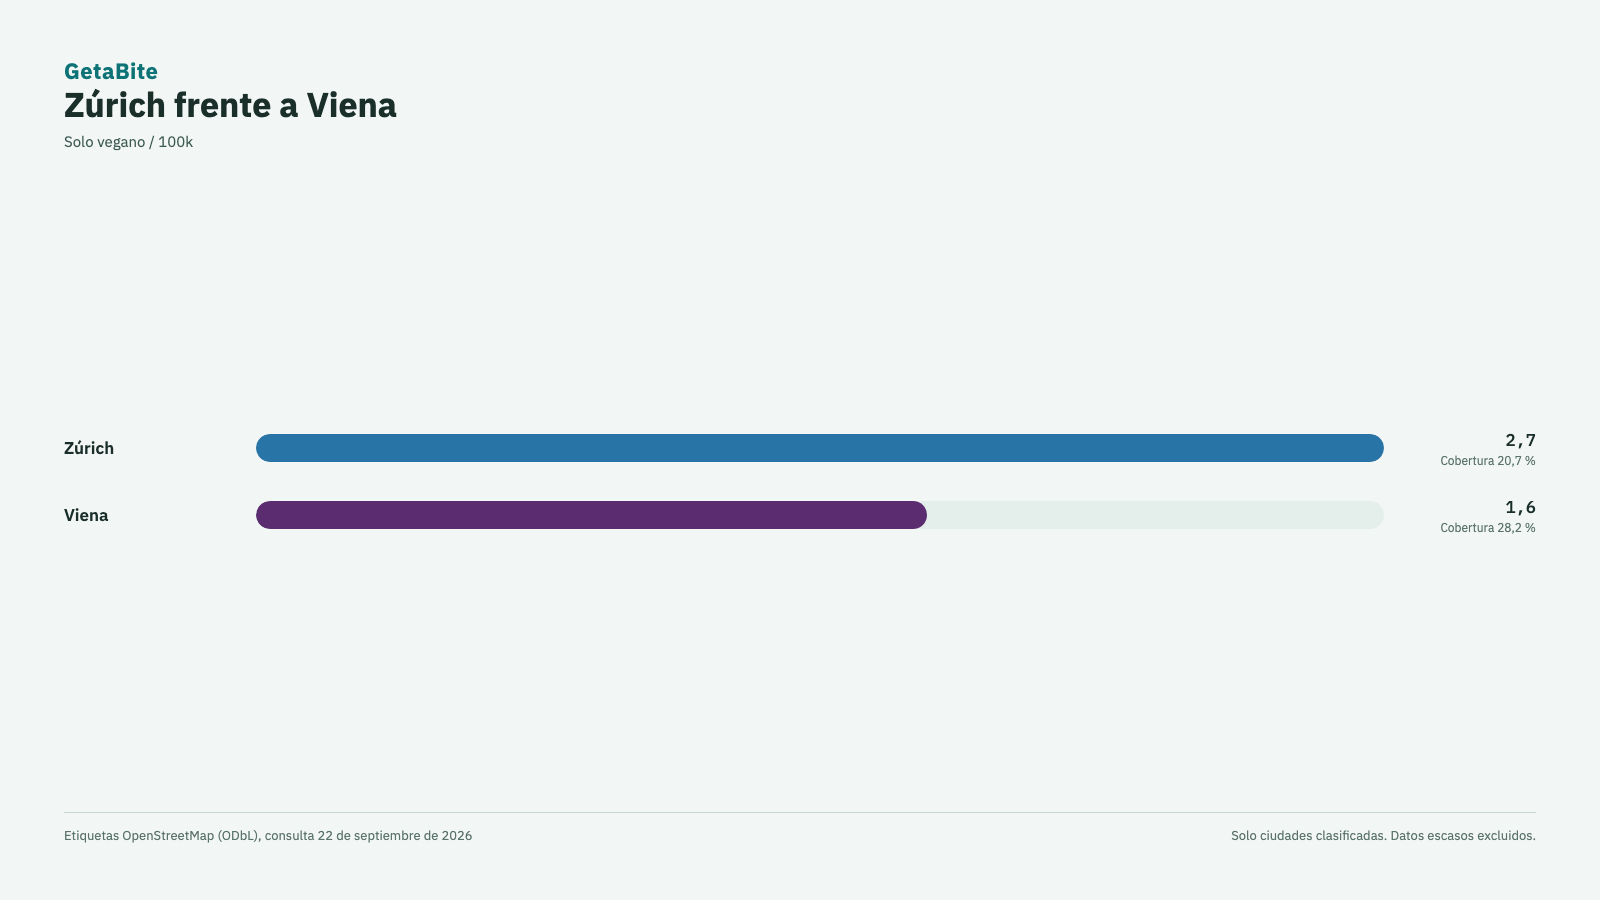
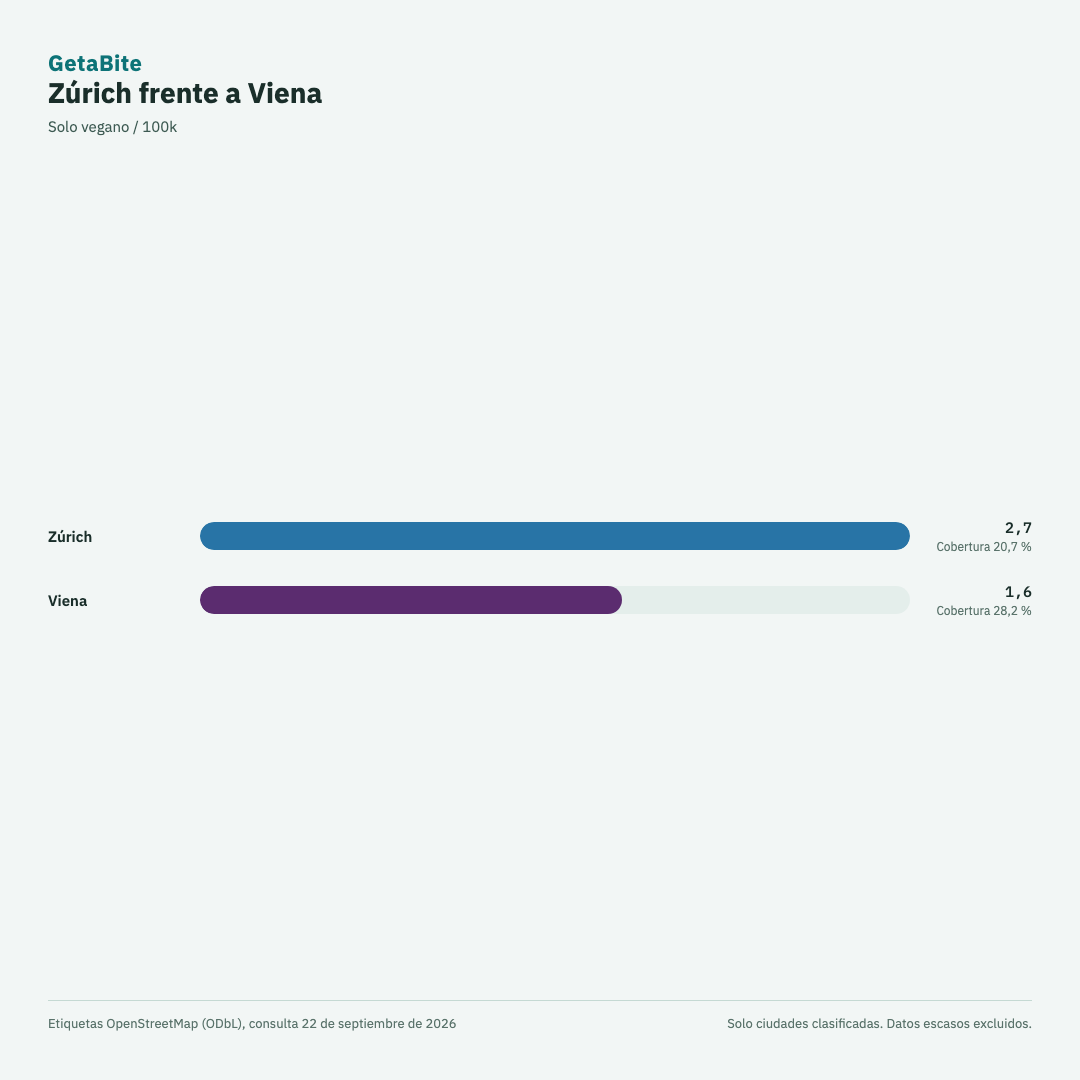
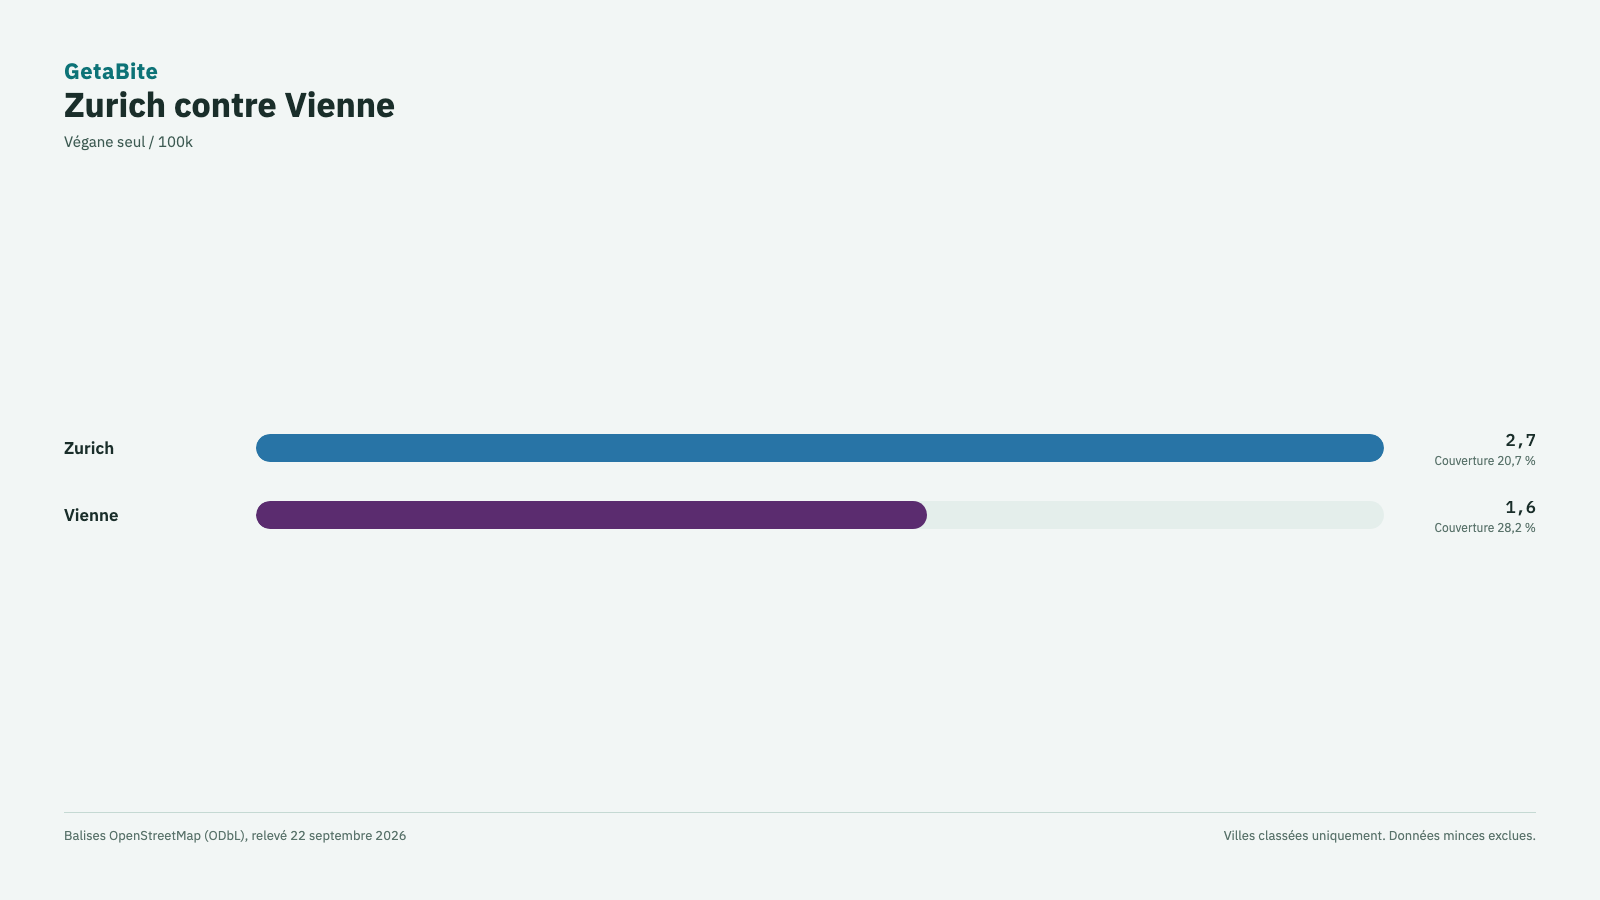
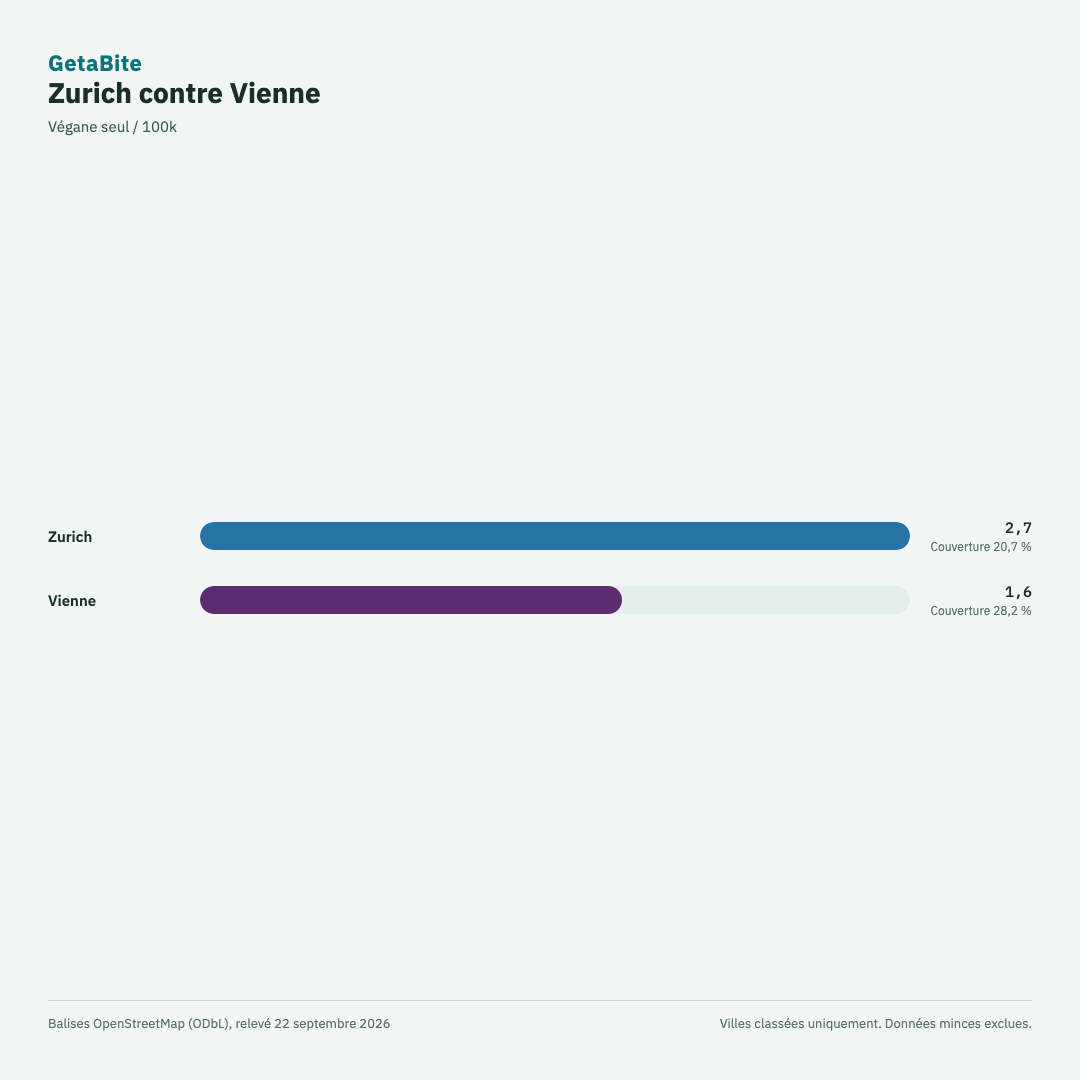
Duel: Zurich vs Vienna
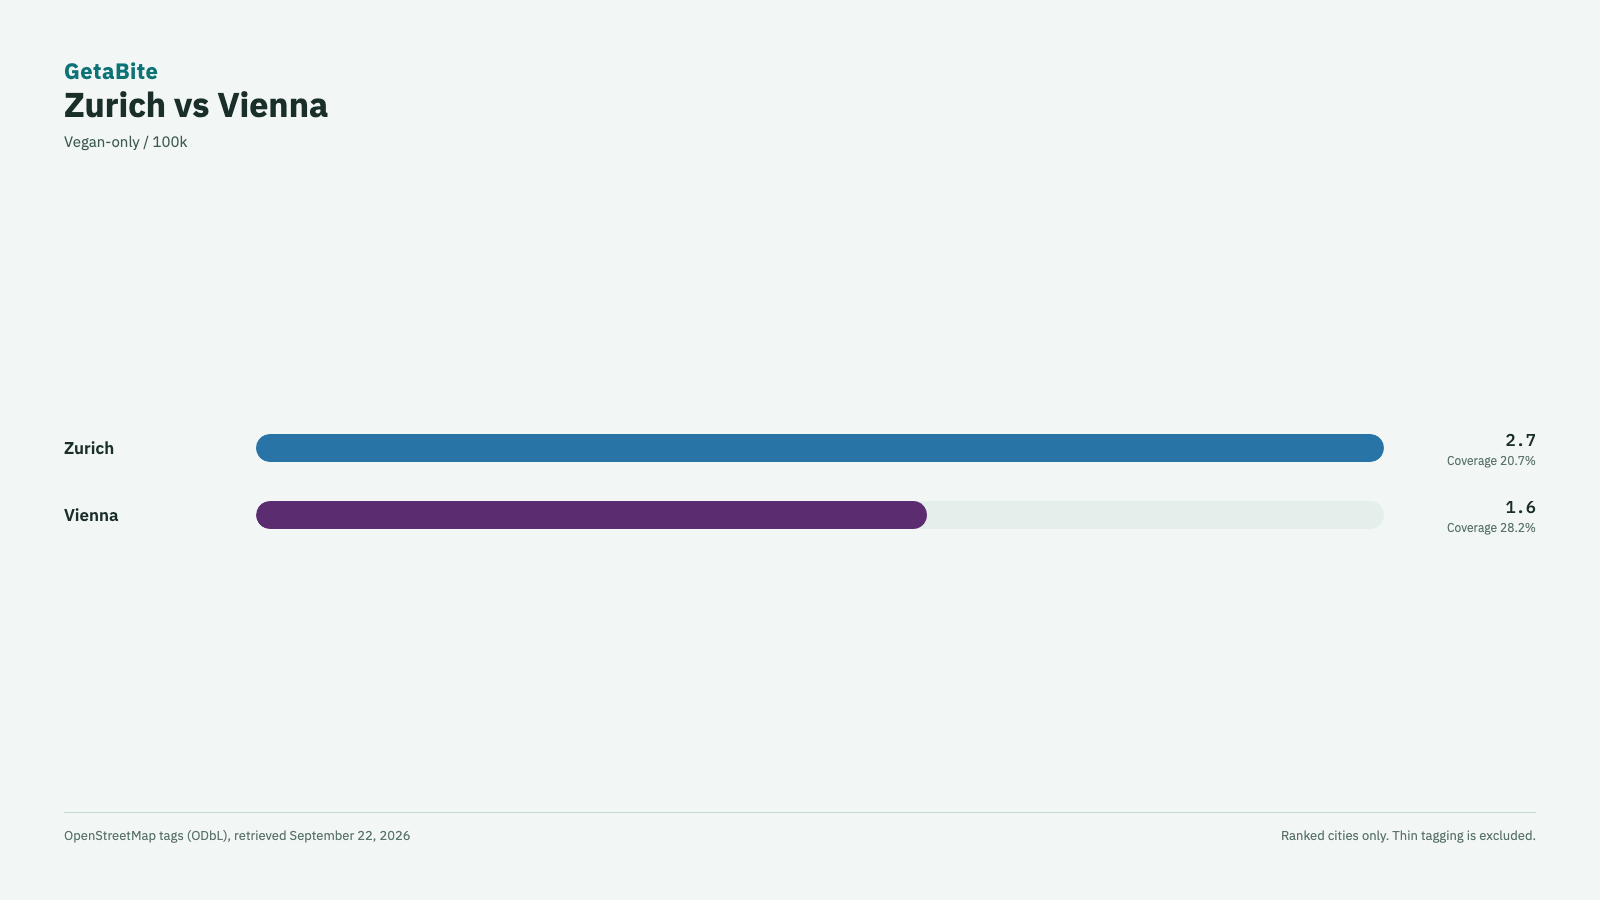
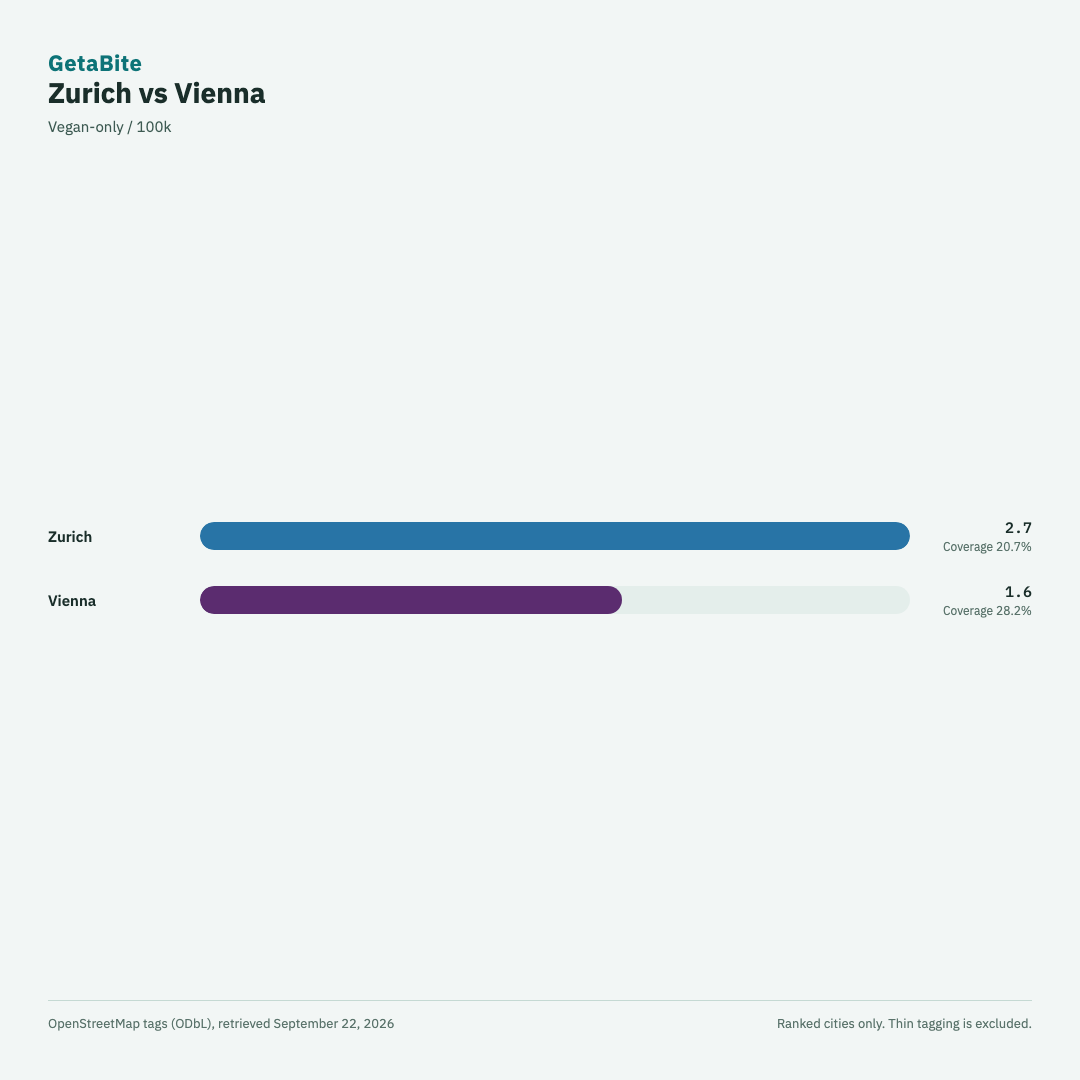
de Landscape · de Square · es Landscape · es Square · fr Landscape · fr Square
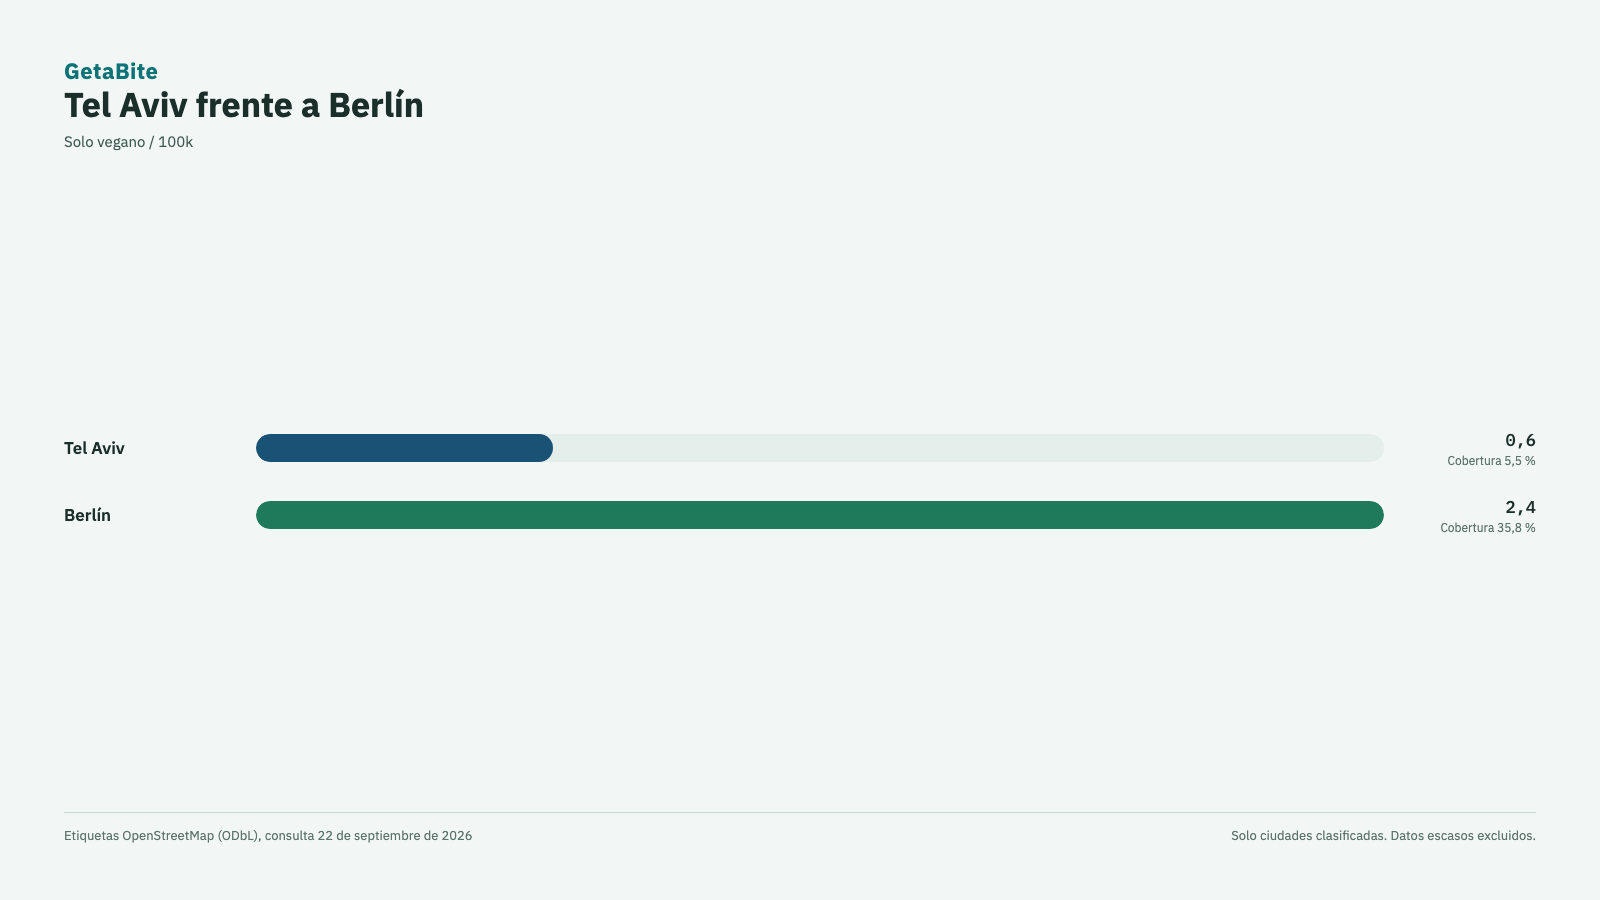
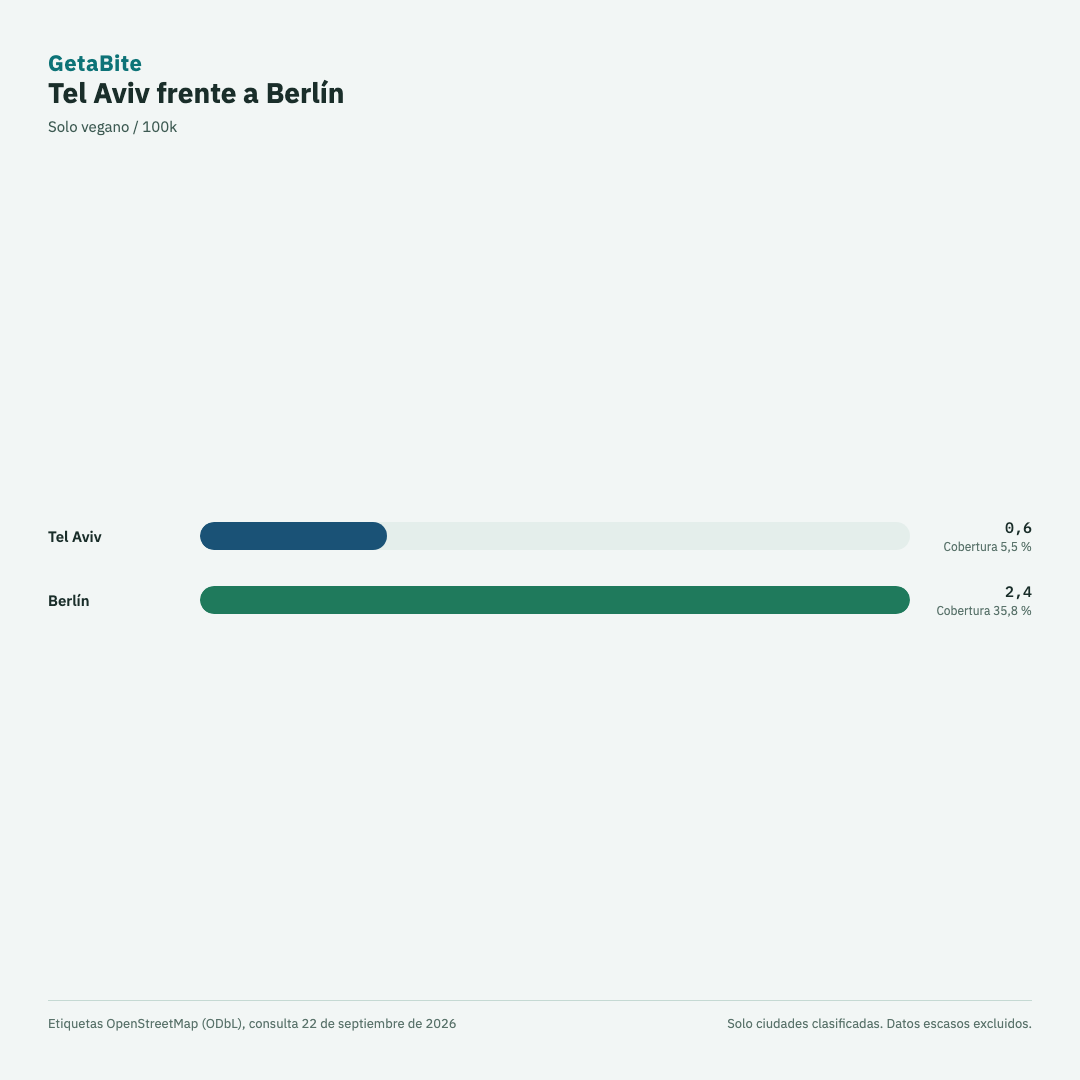
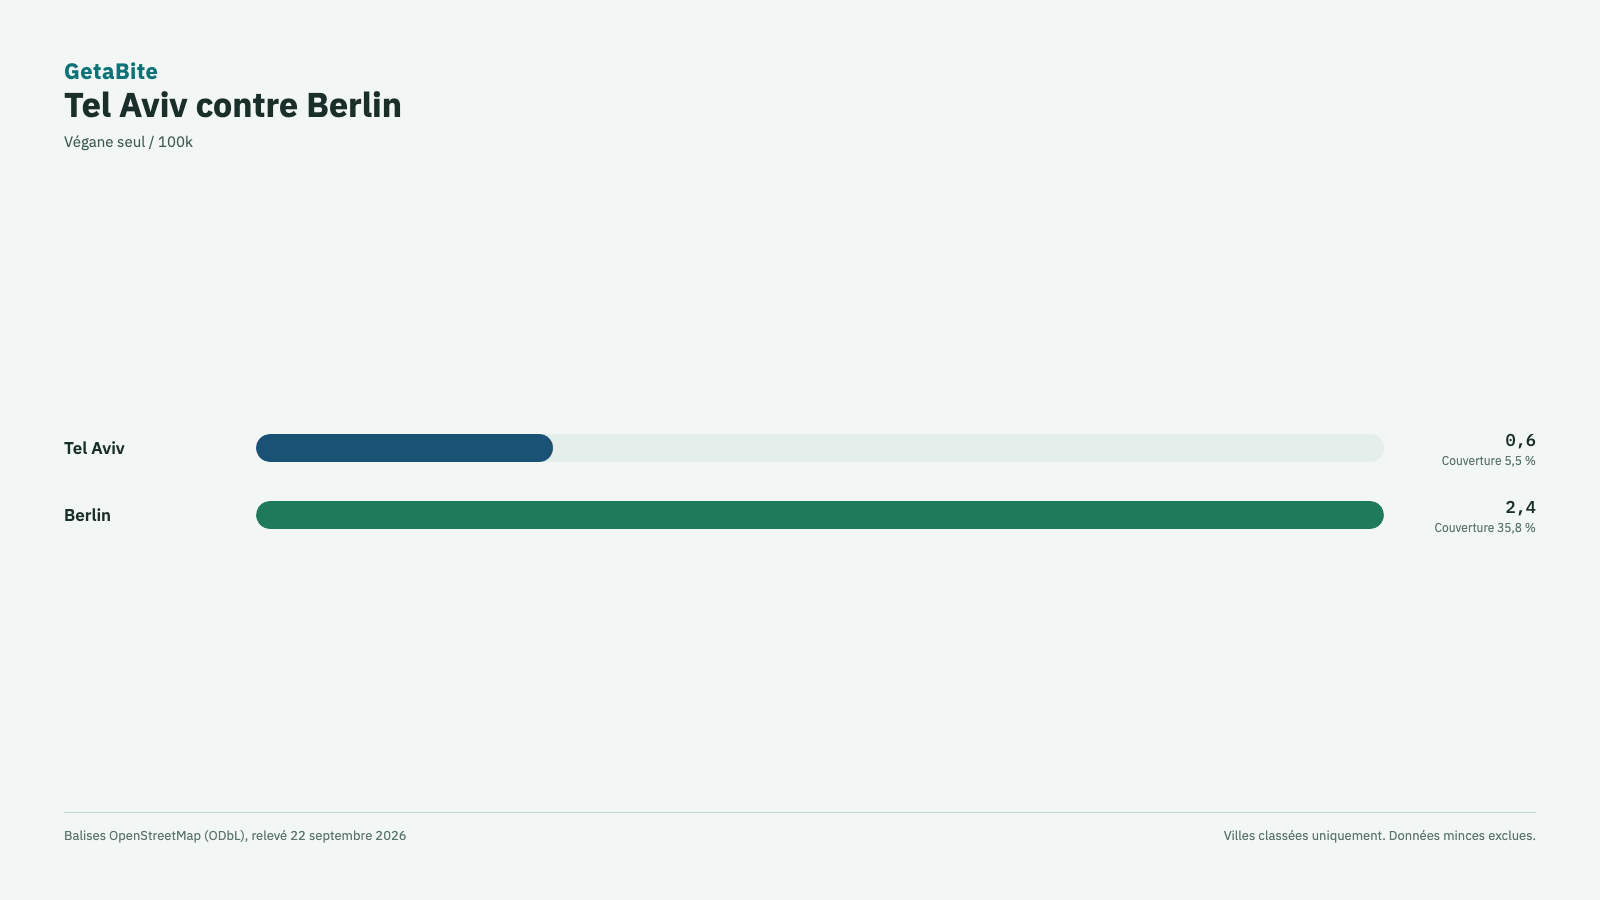
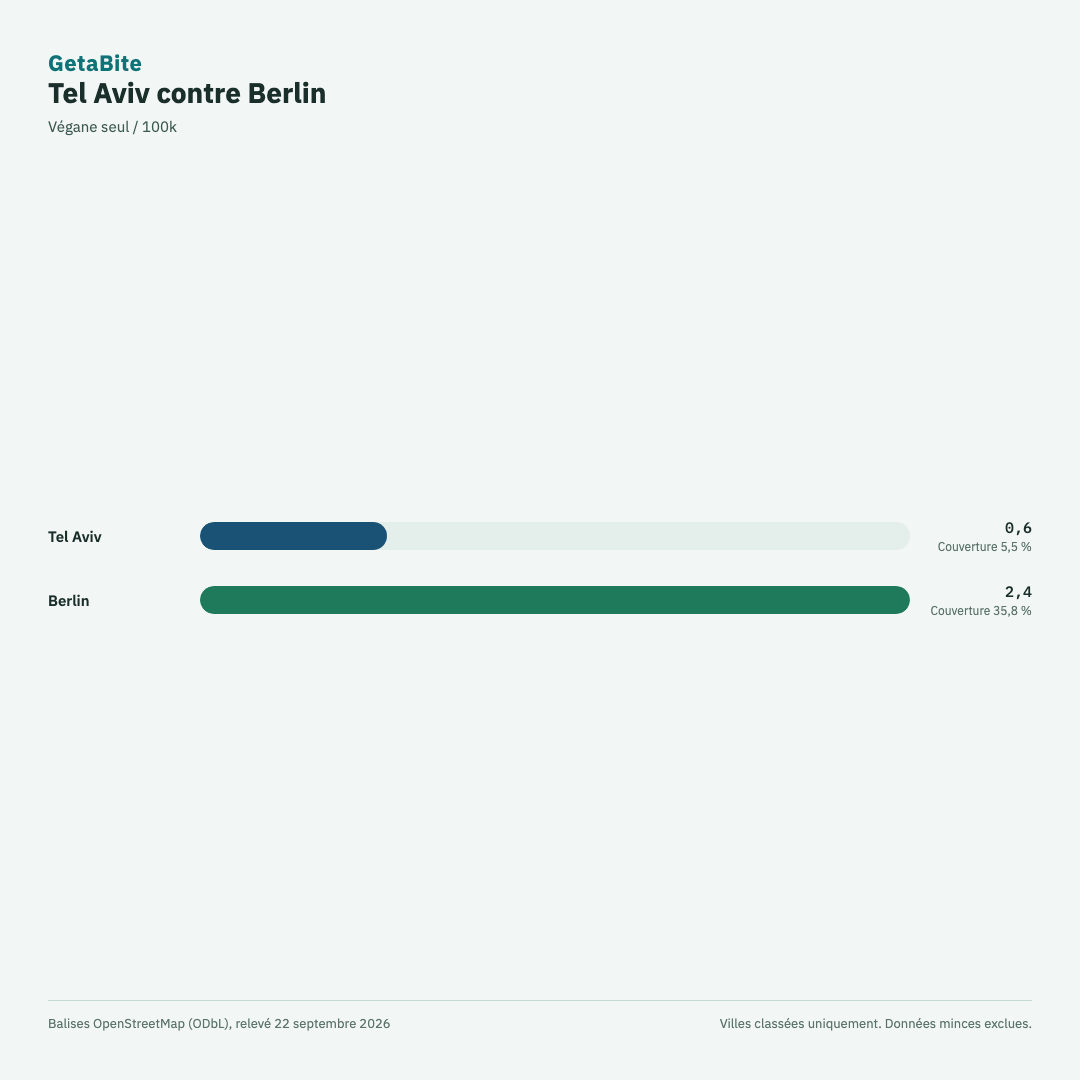
Duel: Tel Aviv vs Berlin
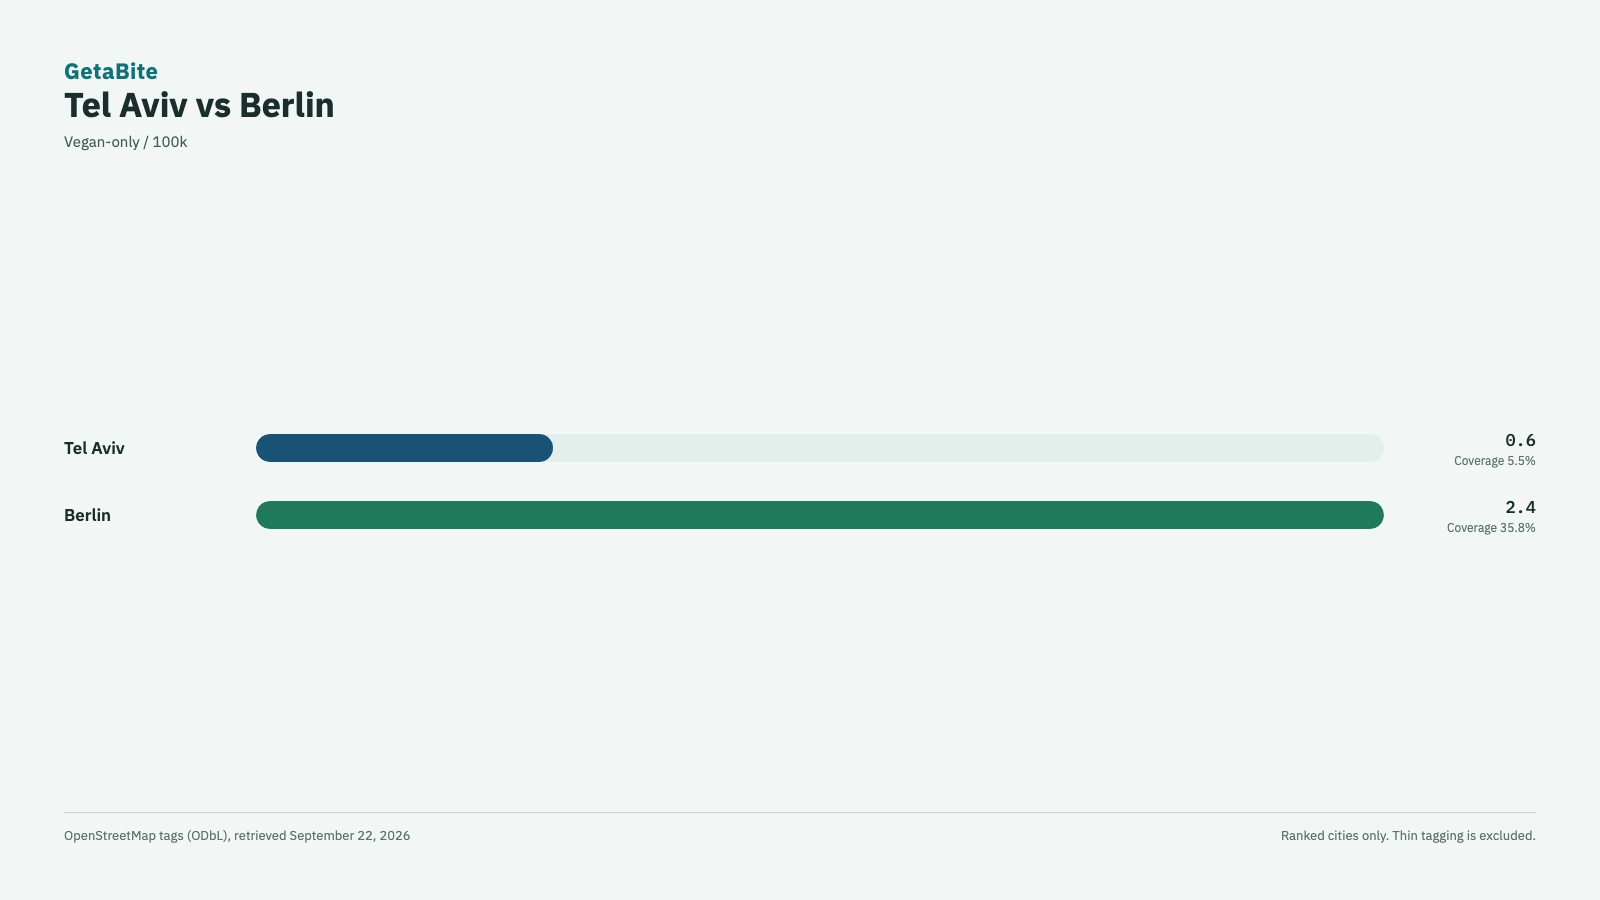
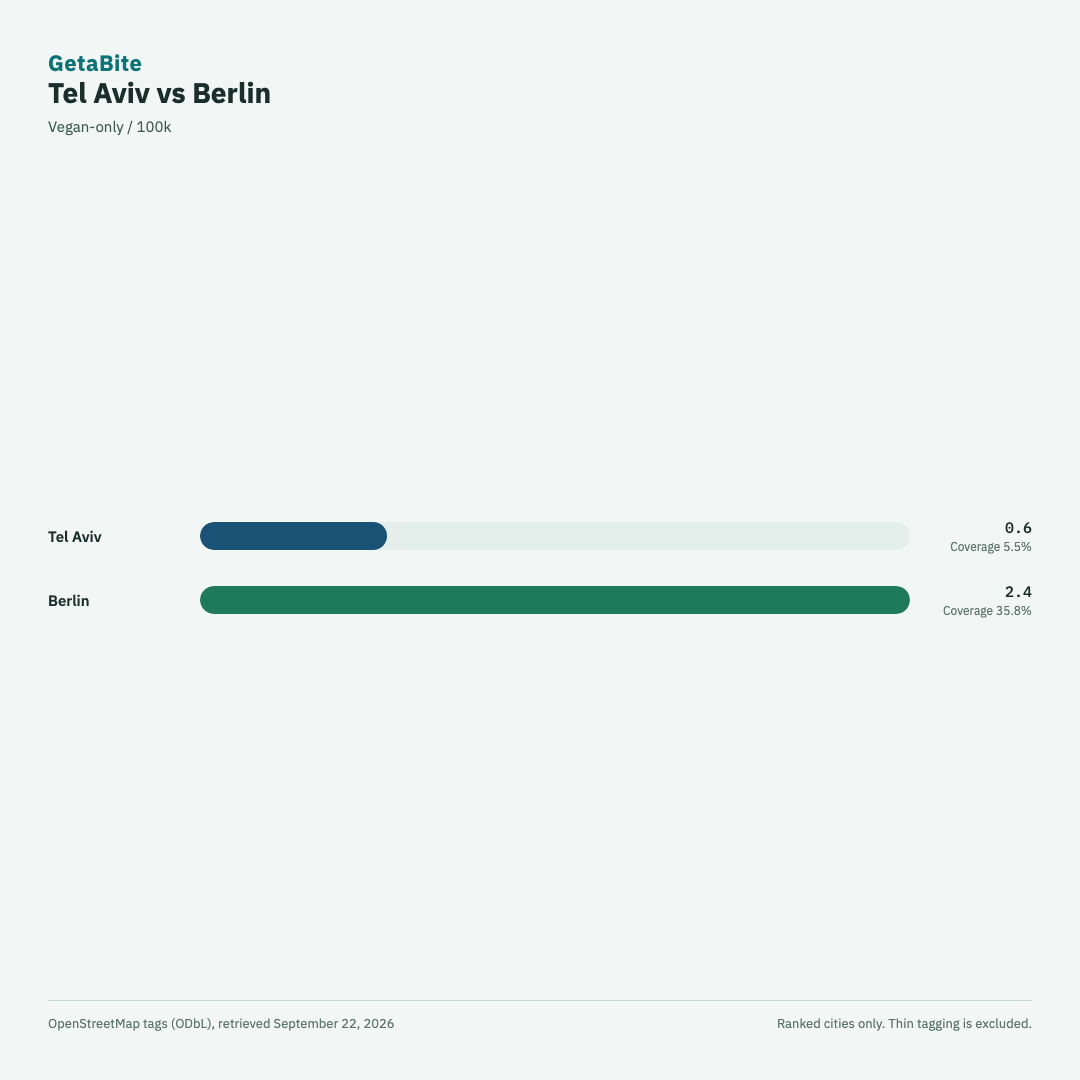
de Landscape · de Square · es Landscape · es Square · fr Landscape · fr Square
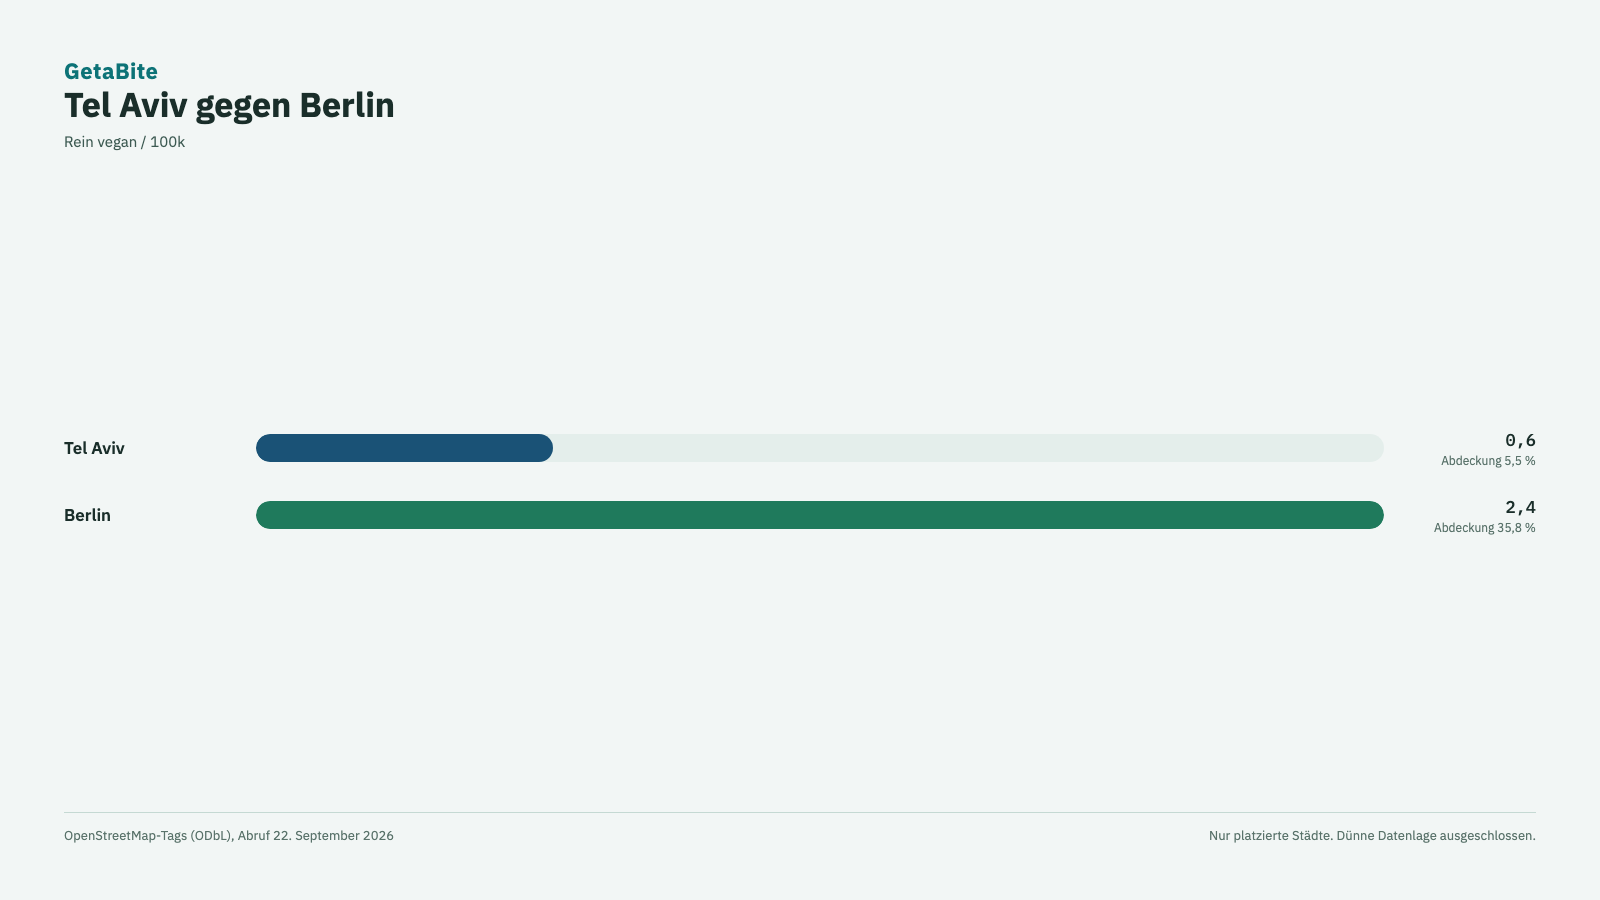
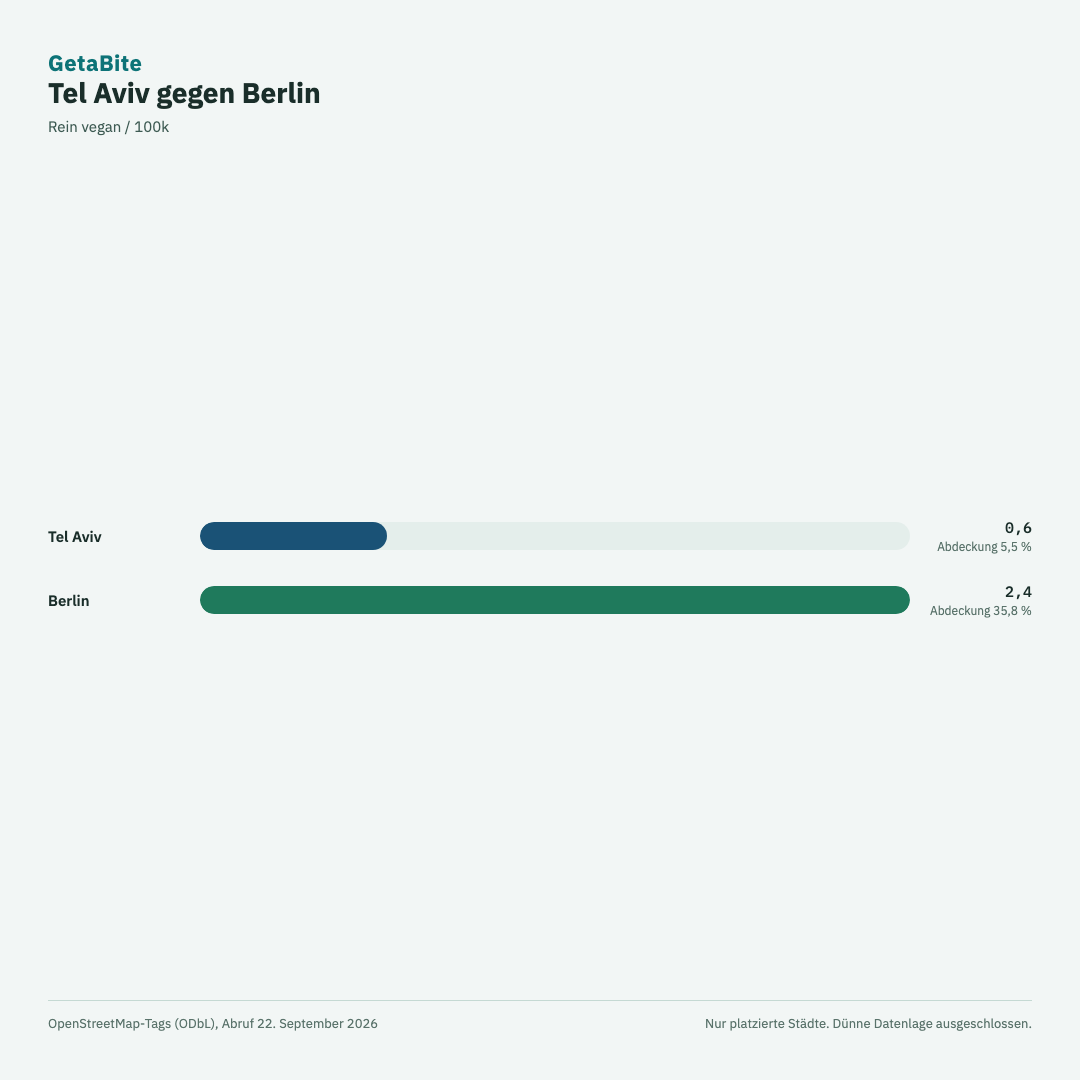
Raw data (CSV)
One row per city with counts, coverage, per-capita metrics, rank, and thin-data flags. Matches the published JSON snapshot.
OpenStreetMap data © OpenStreetMap contributors, ODbL 1.0. Population from Wikidata (CC0).
Cities with thin data
These cities are not ranked. Diet tags are too sparse for a fair place in the list.
| City | Coverage | Diet tags | Why unranked |
|---|---|---|---|
| Madrid | 5% | 360 | Diet-tag coverage below 5 percent |
| Los Angeles | 4.8% | 334 | Diet-tag coverage below 5 percent |
| Cape Town | 4.4% | 40 | Diet-tag coverage below 5 percent |
| Lisbon | 4.3% | 215 | Diet-tag coverage below 5 percent |
| Porto | 4.3% | 104 | Diet-tag coverage below 5 percent |
| Chicago | 3.8% | 158 | Diet-tag coverage below 5 percent |
| Melbourne | 3.7% | 194 | Diet-tag coverage below 5 percent |
| Athens | 3.6% | 205 | Diet-tag coverage below 5 percent |
| Singapore | 3.5% | 244 | Diet-tag coverage below 5 percent |
| Rome | 3.4% | 181 | Diet-tag coverage below 5 percent |
| Sydney | 3.1% | 165 | Diet-tag coverage below 5 percent |
| Toronto | 3.1% | 181 | Diet-tag coverage below 5 percent |
| Bangkok | 3.1% | 191 | Diet-tag coverage below 5 percent |
| São Paulo | 3.1% | 137 | Diet-tag coverage below 5 percent |
| Marrakech | 3% | 25 | Diet-tag coverage below 5 percent |
| Milan | 2.9% | 179 | Diet-tag coverage below 5 percent |
| Kuala Lumpur | 2.9% | 154 | Diet-tag coverage below 5 percent |
| Miami | 2.7% | 27 | Diet-tag coverage below 5 percent |
| Taipei | 2.6% | 415 | Diet-tag coverage below 5 percent |
| Buenos Aires | 2.3% | 124 | Diet-tag coverage below 5 percent |
| Lima | 2.1% | 105 | Diet-tag coverage below 5 percent |
| Bogotá | 2% | 117 | Diet-tag coverage below 5 percent |
| Nairobi | 1.9% | 21 | Diet-tag coverage below 5 percent |
| Auckland | 1.7% | 53 | Diet-tag coverage below 5 percent |
| Santiago | 1.6% | 74 | Diet-tag coverage below 5 percent |
| Mexico City | 1.6% | 93 | Diet-tag coverage below 5 percent |
| Cairo | 1.6% | 19 | Diet-tag coverage below 5 percent |
| Piraeus | 1.6% | 15 | Diet-tag coverage below 5 percent |
| Rio de Janeiro | 1.5% | 40 | Diet-tag coverage below 5 percent |
| Hong Kong | 1.5% | 65 | Diet-tag coverage below 5 percent |
| Istanbul | 1.5% | 130 | Diet-tag coverage below 5 percent |
| Tokyo | 1.2% | 302 | Diet-tag coverage below 5 percent |
| Beijing | 1.1% | 47 | Diet-tag coverage below 5 percent |
| Osaka | 0.4% | 57 | Diet-tag coverage below 5 percent |
| Seoul | 0.2% | 90 | Diet-tag coverage below 5 percent |
| Lagos | 0% | 0 | Coverage below 5 percent and fewer than 5 diet-tagged places |
Contact
Questions about the data or charts: hello@getabite.app